Gold is toying with us
There are two ways the rally in the gold market could play out, says John C Burford. And it all comes down to this key level of resistance in the charts.
Get the latest financial news, insights and expert analysis from our award-winning MoneyWeek team, to help you understand what really matters when it comes to your finances.
You are now subscribed
Your newsletter sign-up was successful
Want to add more newsletters?

Twice daily
MoneyWeek
Get the latest financial news, insights and expert analysis from our award-winning MoneyWeek team, to help you understand what really matters when it comes to your finances.

Four times a week
Look After My Bills
Sign up to our free money-saving newsletter, filled with the latest news and expert advice to help you find the best tips and deals for managing your bills. Start saving today!
This will be a brief follow-up to my lastpost on gold on 24 October. I'll illustrate how I use Fibonacci to project support/resistance levels and then use Elliott wave theory to pencil in a likely path for prices in the near and medium term.
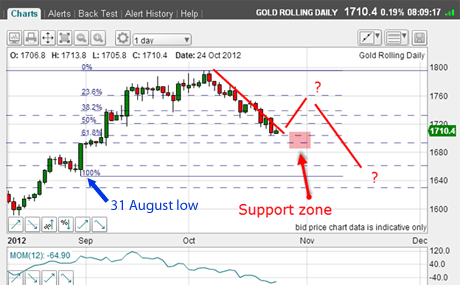
Last time, I showed the daily chart (below), showing the large decline off the $1,796 high of 4 October.
I had two separate Fibonacci sets derived from two separate low pivot points and projected a support zone surrounding the two Fibonacci levels in my pink zone.
MoneyWeek
Subscribe to MoneyWeek today and get your first six magazine issues absolutely FREE

Sign up to Money Morning
Don't miss the latest investment and personal finances news, market analysis, plus money-saving tips with our free twice-daily newsletter
Don't miss the latest investment and personal finances news, market analysis, plus money-saving tips with our free twice-daily newsletter
I also forecasted a bounce up from support and then a fresh decline to eventually take the market below this support. Beware - the red lines in the chart are not to scale!

(Click on the chart for a larger version)
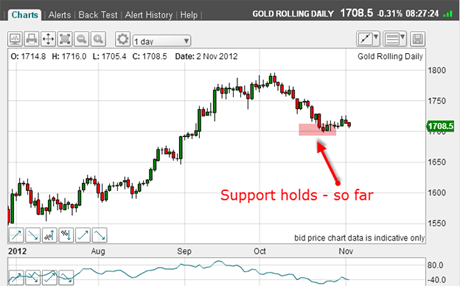
And this is how the market has developed:

(Click on the chart for a larger version)
The market has indeed found support in my pink zone and is staging a rally.But so far, this rally is very weak.Is this a worry for the bulls?
Let's zoom in on the hourly chart:

(Click on the chart for a larger version)
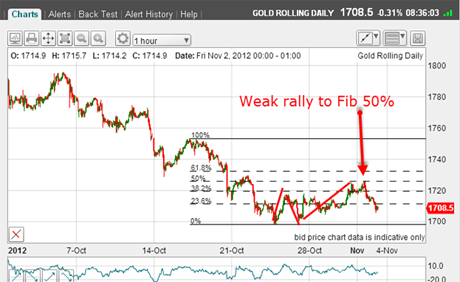
I have drawn the Fibonacci levels using the most recent significant high at $1,752 as my high pivot point.
And the market has only managed to reach the 50% level, so far.I have drawn in the A-B-C form to this rally (red lines).
Remember, an A-B-C rally form indicates that the larger trend (down) remains intact, and we should be trading from the short side.
So, at first glance, it appears the bounce has run its course, and we can expect an imminent plunge below the $1,700 level.
A line in the sand
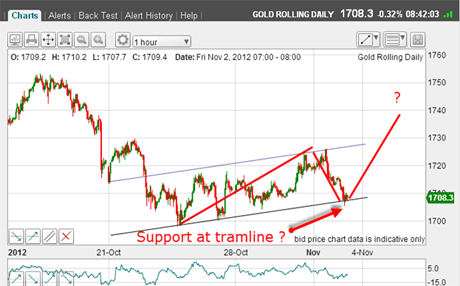
But, as ever, we must also consider alternative probabilities and here is one:

(Click on the chart for a larger version)
I have an excellent tramline pair, complete with aprior pivot point(PPP) on the upper line.The market is currently testing support at the lower tramline at the $1,709 level.
So I have a line in the sand for this interpretation:if the market breaks support here, my original scenario will be playing out, in all likelihood. But if the market rallies off current levels, that would strengthen the alternative scenario.
I will not have long to wait for the resolution, as the important US October Non-Farms Payroll data will be released later today.
How can markets suddenly change direction?
Flash news: The employment data is now out and appears very bullish for shares and bearish for gold, with the market crashing below the $1,700 level. The resolution has arrived.
Sentiment drives markets, not data.It is the consensus interpretation of data that is the guiding force.And I have shown in theseposts that when consensus is heavily to either the bull or bear side, that is when we should expect a major trend change, and I have given many examples in real time.
If sentiment reverses sharply, the market can very quickly reverse with it.
At workshops, I often get questions asking me how can a sudden change in sentiment occur. After all, bullish sentiment, say, is built up over time with due consideration by the market players. The strongly bullish interpretation of data gathers more and more adherents until the market shows a distinct upward trend.
So how can this mass belief in the rightness of the bull position change almost overnight? Surely, there are few sudden unexpected events that can cause this? Most sudden' events can be forecast well in advance!
Recently, I came across a modern-day Aesop fable appropriate as winter approaches.
Imagine a pond that has frozen overnight. Before, there was no ice on the pond, but suddenly, the situation has changed. An early riser on his walk sees the ice and eagerly decides to get his skates out of the garage and call his friends to join him.
At first, they gingerly step onto the edge and find the ice is thick enough to support them.Then, as word spreads, more people join them and soon they are all having a wonderful time, even displaying moves they haven't done in years. What could possibly spoil this party?
But the ice is getting crowded.Someone becomes nervous that the ice will not be able to hold them all. He tells his friend he is worried, but is told not to worry don't be a party pooper!So he stays.
Then, just as one more person steps onto the ice, loud cracks are heard.Some make it back to land, but most fall into the water as the ice gives way.
Think about that these cold November mornings!
If you're a new reader, or need a reminder about some of the methods I refer to in my trades, then do have a look at my introductory videos:
The essentials of tramline trading
An introduction to Elliott wave theory
Advanced trading with Elliott waves
Don't miss my next trading insight. To receive all my spread betting blog posts by email, as soon as I've written them, just sign up here . If you have any queries regarding MoneyWeek Trader, please contact us here.
Get the latest financial news, insights and expert analysis from our award-winning MoneyWeek team, to help you understand what really matters when it comes to your finances.
John is is a British-born lapsed PhD physicist, who previously worked for Nasa on the Mars exploration team. He is a former commodity trading advisor with the US Commodities Futures Trading Commission, and worked in a boutique futures house in California in the 1980s.
He was a partner in one of the first futures newsletter advisory services, based in Washington DC, specialising in pork bellies and currencies. John is primarily a chart-reading trader, having cut his trading teeth in the days before PCs.
As well as his work in the financial world, he has launched, run and sold several 'real' businesses producing 'real' products.
-
 MoneyWeek Talks: The funds to choose in 2026
Podcast Fidelity's Tom Stevenson reveals his top three funds for 2026 for your ISA or self-invested personal pension
-
 Three companies with deep economic moats to buy now
Opinion An economic moat can underpin a company's future returns. Here, Imran Sattar, portfolio manager at Edinburgh Investment Trust, selects three stocks to buy now