Tramlines tame the volatile Dow
Despite being in a state of flux, the Dow has followed John C Burford's tramlines to the letter. But where will it go now?
Get the latest financial news, insights and expert analysis from our award-winning MoneyWeek team, to help you understand what really matters when it comes to your finances.
You are now subscribed
Your newsletter sign-up was successful
Want to add more newsletters?

Twice daily
MoneyWeek
Get the latest financial news, insights and expert analysis from our award-winning MoneyWeek team, to help you understand what really matters when it comes to your finances.

Four times a week
Look After My Bills
Sign up to our free money-saving newsletter, filled with the latest news and expert advice to help you find the best tips and deals for managing your bills. Start saving today!
In Monday's poston the Nasdaq, I mentioned the market fireworks on Friday where we saw big losses.Today, I have to report more fireworks - with big gains!
The volatility I had expected over the US election drama was in full flow.
For instance, gold was down $35 on Friday; yesterday, it came roaring back with gains of $40 (I hope to cover gold on Friday).
MoneyWeek
Subscribe to MoneyWeek today and get your first six magazine issues absolutely FREE

Sign up to Money Morning
Don't miss the latest investment and personal finances news, market analysis, plus money-saving tips with our free twice-daily newsletter
Don't miss the latest investment and personal finances news, market analysis, plus money-saving tips with our free twice-daily newsletter
But once in a while, a market draws such a compelling picture that even having studied charts for some years, I am taken aback!
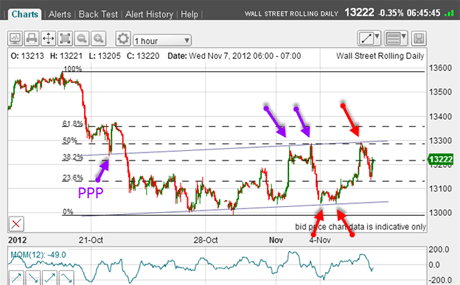
And this very morning, when I fired up my PC, I was greeted by this hourly Dow chart:

(Click on the chart for a larger version)
The first tramline I could draw is the upper one using the solid prior pivot point (PPP), and the two high touch-points from Friday.
In fact, I had already drawn in this line on Friday as the market was rallying up to the second purple point. This was where I placed an order to short the Dow close to the 13,000 level.
Because I entered right on the tramline, I could then place a close protective stop just above the line.Because of my tight stop, this was a low-risk trade. As I always advise, for swing trading, select only the low-risk situations.This was pure textbook.
And with the huge fall on Friday, I believe I had a winner!But to play safe, I moved my protective stop to break-even. I believed the market would be volatile around the US elections and the odds were on for a snap-back rally and I did not want to be caught out.
I have an ace up my sleeve!
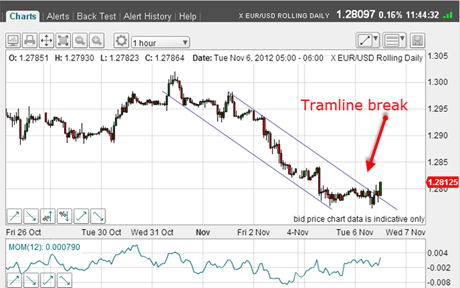
Because of the distinct possibility of a snap-back rally, I decided to hedge my short Dow with a long euro position:

(Click on the chart for a larger version)
What I liked about this trade was that the momentum was strengthening as the market declined. With the tramline break, I had a perfect hedge.
Trader tip:When approaching a large market event which is likely to shake things up, such as a US election, you can look to hedge your positions in a related market. This is for an advanced trading course, as this is a complex area.
I can now move my protective stop on this trade to break-even.So now I am in the enviable position of having a position in the Dow and the euro and my worst case scenario is break-even.How many traders can claim that in a volatile period?
Back to the Dow - and yesterday, the market got wind of an Obama victory. That signalled more of the same loose Fed fiscal policy and the market took off like a rocket, and took me out of my short trade at break-even.
Remember, the art of making money in the markets also includes not losing any on your wrong trades! That is why I use my break-even rule.
But with Monday's low in place, I could draw the lower tramline with those lows lying right on this line (lower red arrows in my first chart). Short-term traders would be looking to take profits near these lows, of course.
But look at where the rally was turned away right on my upper tramline (top red arrow).That is impressive.
I really cannot offer a better example of tramlines in action. They are a powerful weapon in my armoury.
On Monday, while covering the Nasdaq, I said that I expected a good bounce since the market was eating into major support from the congestion zone of last summer. And this is exactly what is occurring this week.
So the big question is where to now?
The right strategy is to do nothing
I have drawn in the Fibonacci levels using the most recent 18 October high as ahigh pivot point.We have hit the 50% level last week andagain yesterday. Will it power through to the 62% level?
In terms of tactics, my sensible policy isto sit on my hands while the market develops new patterns. And I don't think I will have to wait long!
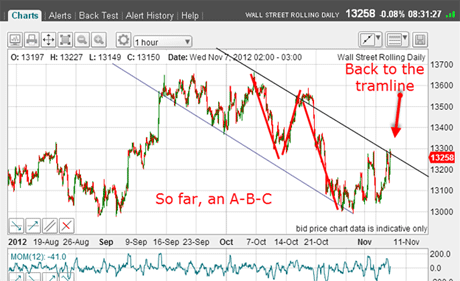
Here is the hourly chart as I write:

(Click on the chart for a larger version)
I now have a new set of tramlines to work with. The lower one has many touch-points, while the upper one is a little uncertain as yet.
But the market is pushing up against the upper line.And if the market wishes to make upside progress, it will need to contend with the congestion zone just above.
Another point is that the decline off the 13,660 high can be counted as an A-B-C (corrective) so far.
These are some of the many cross-currents at play which is giving us this high volatility.
But with the election now out of the way, will we see any downward correction off my tramline as the market comes face to face with the problems of the US economy, such as the fiscal cliff a few weeks away?
With 250-pip swings in rapid succession now common, I will be changing my strategies, so stay tuned to my posts.
If you're a new reader, or need a reminder about some of the methods I refer to in my trades, then do have a look at my introductory videos:
The essentials of tramline trading
An introduction to Elliott wave theory
Advanced trading with Elliott waves
Don't miss my next trading insight. To receive all my spread betting blog posts by email, as soon as I've written them, just sign up here . If you have any queries regarding MoneyWeek Trader, please contact us here.
Get the latest financial news, insights and expert analysis from our award-winning MoneyWeek team, to help you understand what really matters when it comes to your finances.
John is is a British-born lapsed PhD physicist, who previously worked for Nasa on the Mars exploration team. He is a former commodity trading advisor with the US Commodities Futures Trading Commission, and worked in a boutique futures house in California in the 1980s.
He was a partner in one of the first futures newsletter advisory services, based in Washington DC, specialising in pork bellies and currencies. John is primarily a chart-reading trader, having cut his trading teeth in the days before PCs.
As well as his work in the financial world, he has launched, run and sold several 'real' businesses producing 'real' products.
-
 8 ways the ‘sandwich generation’ can protect wealth
People squeezed between caring for ageing parents and adult children or younger grandchildren – known as the ‘sandwich generation’ – are at risk of neglecting their own financial planning. Here’s how to protect yourself and your loved ones’ wealth.
-
 What are Avios-only flights and who is eligible?
Avios-only flights have proved incredibly popular since launching in 2023. We explain what they are, how they work and who qualifies