The holy grail of trading the markets
John C Burford looks at how to find the holy grail of trading - identifying high-probability, low-risk positions.
Get the latest financial news, insights and expert analysis from our award-winning MoneyWeek team, to help you understand what really matters when it comes to your finances.
You are now subscribed
Your newsletter sign-up was successful
Want to add more newsletters?

Twice daily
MoneyWeek
Get the latest financial news, insights and expert analysis from our award-winning MoneyWeek team, to help you understand what really matters when it comes to your finances.

Four times a week
Look After My Bills
Sign up to our free money-saving newsletter, filled with the latest news and expert advice to help you find the best tips and deals for managing your bills. Start saving today!
Finding a way to identify high-probability positions that can be taken at low risk is the holy grail of trading.
I will therefore continue with this week's theme the FTSE - because it has been providing some great examples of how useful my methods are in forecasting market turning points. And this is what enables high-probability positions to be taken at a low risk.
They also allow for exit targets for your live trades to be forecast well in advance. No more fumbling around in indecision!
MoneyWeek
Subscribe to MoneyWeek today and get your first six magazine issues absolutely FREE

Sign up to Money Morning
Don't miss the latest investment and personal finances news, market analysis, plus money-saving tips with our free twice-daily newsletter
Don't miss the latest investment and personal finances news, market analysis, plus money-saving tips with our free twice-daily newsletter
The method that can help identify these trades is measured by the reward/risk ratio. In my swing trading, I want to search out trades that carry a reward/risk ratio of at least three-to-one.
You should monitor several indexes
But they all have their distinctive chart patterns, and what may be a clear Elliott wave pattern in one index may be a muddy picture in another. That is why I monitor movements in several stock indexes.
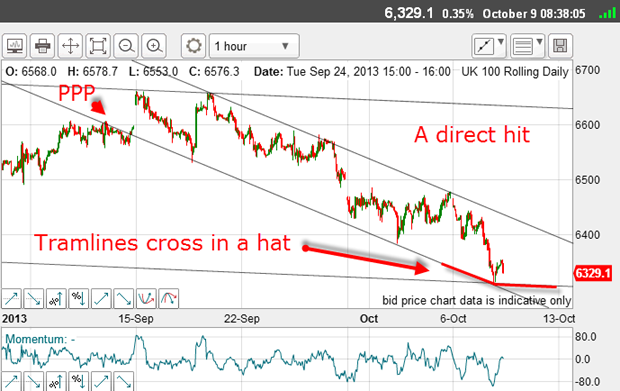
On Wednesday, I showed this chart:

The market had declined right into my hat where tramlines crossed in a clear five-wave pattern. This hat pattern is a powerful area of support and usually leads to a reversal.
How to set your downside target area
I had all of the touch points available for my tramlines by Wednesday 2 October, when the last minor low was set.
The only one to be put in later was the Friday 4 October high for the upper tramline, but I already had the two major upper touch points from previous trading.
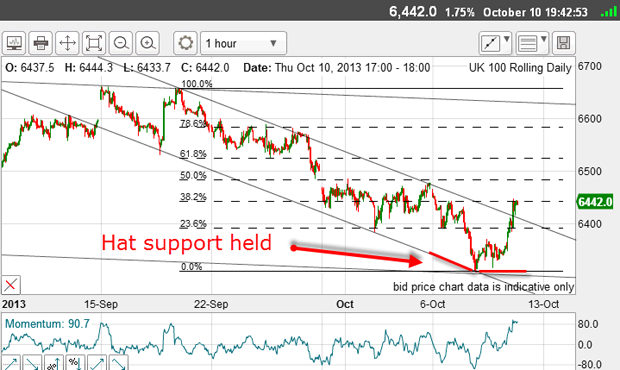
Let's see if this target was indeed the low for the move. Here is the chart updated:

That was spot on and the target was derived solely from applying my tramline technique.
Traders then could have taken profits on short trades and even taken long positions, relying on the hat support to hold.
Now we have a post-crisis rally as there appears to be some kissing and making up in Washington. The sharp rally has broken above my upper tramline and has carried to the Fibonacci 38% retrace of the entire move off the 19 September high.
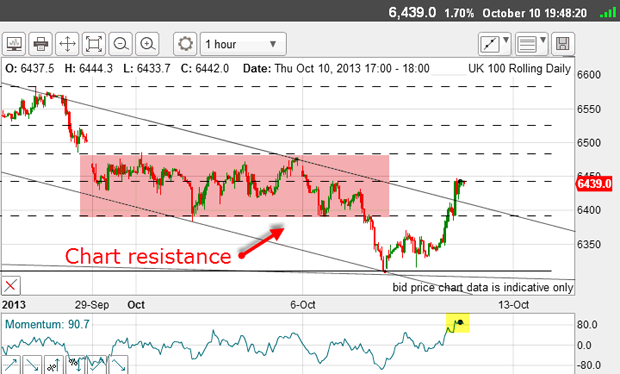
And it is now eating into a zone of overhead resistance:

And momentum is overcooked (yellow highlight). The rally off the Tuesday low has an A-B-C feel to it, leading me to believe the rally should at least pause here, if not entirely reverse. The C wave is extended a not uncommon event.
And since the rally has broken above the upper tramline, I would expect the market to drop down to test the line again anyway.
Verify your forecast using more than one stock index
But what can another stock index tell me to verify this forecast?
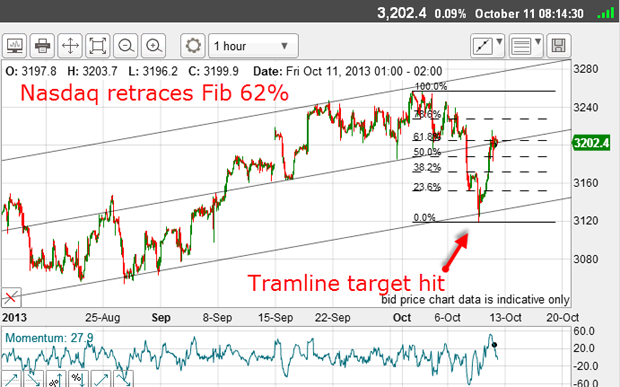
Let's look at the Nasdaq, which has held up well in the face of the sharp decline in the Dow off the 19 September high:

It was as late as yesterday when then Nasdaq finally broke and plunged below the short-term support of my centre tramline.
Note that the decline reversed very close to my lower tramline (with an overshoot, which is typical after a sharp move). Once again, my tramline method predicted this area after the centre tramline had been broken.
Now that the market has taken part in the relief rally, it has carried back to the centre tramline and a Fibonacci 62% retrace of the move off the high and into overhead chart resistance.
This is the moment of truth for both the FTSE and the Nasdaq they have reached their respective critical points.
What is quite remarkable here is that these two disparate indexes (FTSE is full of UK-based mining and financial companies, while Nasdaq has many US high tech firms) have arrived at their own lines in the sand together even though they show totally different chart patterns.
Last time, I wrote about market psychology and this morning, there is palpable relief at the news from Washington that Armageddon in markets seems to have been avoided (or is that postponed?). This is the news and it followed the market!
So, will the markets now sell off in a buy the rumour, sell the news' move, and resume the downtrends?
Get the latest financial news, insights and expert analysis from our award-winning MoneyWeek team, to help you understand what really matters when it comes to your finances.
John is is a British-born lapsed PhD physicist, who previously worked for Nasa on the Mars exploration team. He is a former commodity trading advisor with the US Commodities Futures Trading Commission, and worked in a boutique futures house in California in the 1980s.
He was a partner in one of the first futures newsletter advisory services, based in Washington DC, specialising in pork bellies and currencies. John is primarily a chart-reading trader, having cut his trading teeth in the days before PCs.
As well as his work in the financial world, he has launched, run and sold several 'real' businesses producing 'real' products.
-
 ISA fund and trust picks for every type of investor – which could work for you?
Whether you’re an ISA investor seeking reliable returns, looking to add a bit more risk to your portfolio or are new to investing, MoneyWeek asked the experts for funds and investment trusts you could consider in 2026
-
 The most popular fund sectors of 2025 as investor outflows continue
It was another difficult year for fund inflows but there are signs that investors are returning to the financial markets