The FTSE 100’s spring is uncoiling!
The FTSE 100 has been falling heavily recently. Now it's poised to respond to anything positive, says John C Burford.
Get the latest financial news, insights and expert analysis from our award-winning MoneyWeek team, to help you understand what really matters when it comes to your finances.
You are now subscribed
Your newsletter sign-up was successful
Want to add more newsletters?

Twice daily
MoneyWeek
Get the latest financial news, insights and expert analysis from our award-winning MoneyWeek team, to help you understand what really matters when it comes to your finances.

Four times a week
Look After My Bills
Sign up to our free money-saving newsletter, filled with the latest news and expert advice to help you find the best tips and deals for managing your bills. Start saving today!
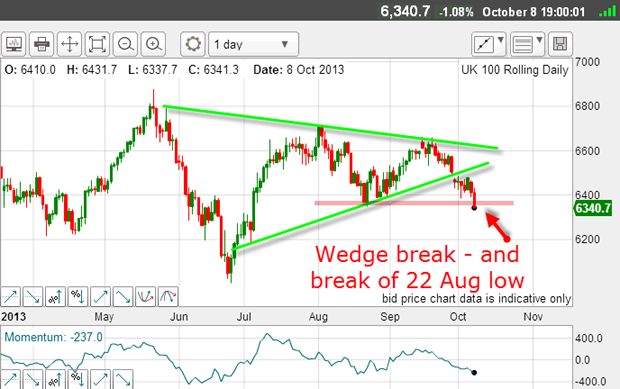
On Monday, I showed the FTSE 100 price action since the 22 May all-time high and likened it to a coiled spring.
I remember when mantelpiece clocks had clockwork movements and the one golden rule that was drummed into me was: never over-wind the spring!
Why? Simply because with a spring that was wound too tightly, the resultant unwind was likely to be violent and break the clock.
MoneyWeek
Subscribe to MoneyWeek today and get your first six magazine issues absolutely FREE

Sign up to Money Morning
Don't miss the latest investment and personal finances news, market analysis, plus money-saving tips with our free twice-daily newsletter
Don't miss the latest investment and personal finances news, market analysis, plus money-saving tips with our free twice-daily newsletter
That thought crossed my mind this morning as I gazed at the FTSE 100 chart:

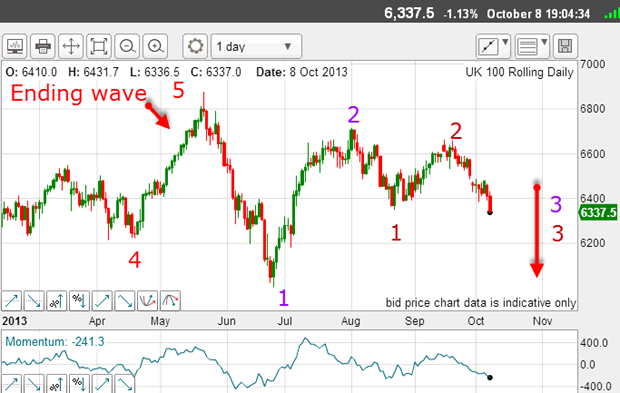
Two third waves?

I have the ending fifth wave to the 22 May high, then a wave 1 down (which contains five sub-waves) with wave 2 up, then a smaller degree wave 1 down to the 22 August low, and then a wave 2 up to the 17 September high.
It now appears we are in two third waves down of a different degree. This is very significant because, if correct, it implies a double dose of third wave action. And we know that third waves are long and strong.
To confirm this picture, I need to see some strong downside moves towards the June low at the 6,000 area.
The alternative view is that the market is tracing out A-B-C corrective moves and that when the C waves are complete the market will rally and go on to make new highs.
I need to see evidence that would eliminate one of the two alternatives.
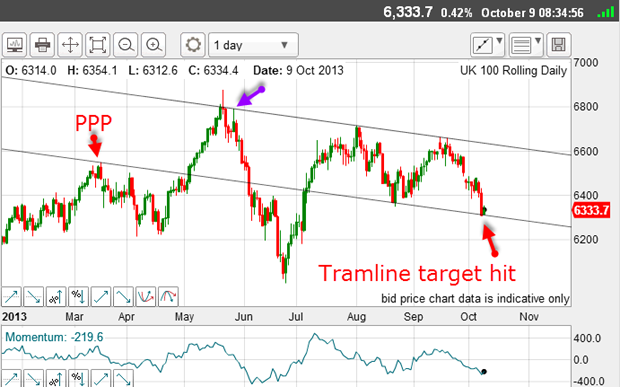
So let's see if I can find any tramlines to determine near-term targets where a turn might start from.

I have a very solid tramline pair with the lower line having a superb prior pivot point (PPP) or two.
The upper line gratifyingly joins the two major highs since August and also the first high after the 22 May top.
This makes my first target at the lower line and the market has made it already.
Naturally, short-term traders could be taking profits on their shorts there.
So what am I looking for in this rally?
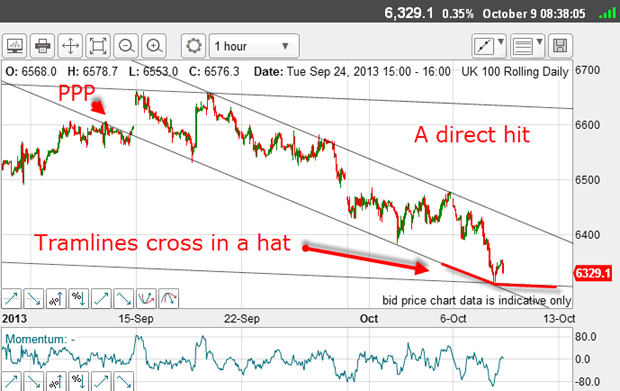
The first task is to zoom in on the hourly chart:

And you see I have a lovely hourly tramline pair with many touch points. Remember, the more touch points you have on a tramline, the more confidence you can have in it.
And note where the two tramlines crossed in a hat' last night that is a doubly powerful area of support. This lies in the 6,300 area.
Bringing psychology into play
The chorus of the end-of-the-world gloomsters reached a climax yesterday, but I was drawing my tramlines as stock markets were in freefall and arrived at this 6,300 area as a likely turning point.
Now, if the rally gathers momentum, you can be sure that there will be some positive news emerging and this will be used by the pundits to explain' the rally. The news follows the markets.
Good traders understand the psychology of the markets, because they know that is what ultimately drives them.
For several days now, the major focus of the markets has been on the US Congress, with many pundits seemingly frustrated with the politicians' inability to get government working.
The market has been falling heavily until last night, when the major players issued press releases reinforcing their polarised positions. On the face of it, this was a bearish event, but the market steadied and then rallied.
To some, this was a perverse reaction. But if they knew the psychology, they would see that now the positions have been openly stated in public. It really can't get any more bearish than that, and so this factor has been fully discounted.
Since the US government shut-down, no major economic reports are being issued, which would normally affect the markets. Markets are flying solo!
The tightly wound clock is about to break
OK, we have a budding rally in the FTSE (and other stocks indexes) this morning. Ideally, I would like to see an A-B-C pattern develop (up-down-up). That is because if I see that, I can say the rally is counter-trend and the main down trend is intact, thus backing up my third wave scenario.
But if the rally extends and moves above my upper tramline, we are almost certainly in the C wave scenario, and new highs would beckon.
Also, there is a gap in the chart around the 6,500 level. Gaps act like magnets, and are eventually filled and this rally could do it.
So, unless the market pushes above the 6,600 area, I will continue to favour my third wave picture. That is my line in the sand.
And of course, if stocks resume their freefall and challenge the major 6,000 low made in June, the spring will be truly uncoiling.
Get the latest financial news, insights and expert analysis from our award-winning MoneyWeek team, to help you understand what really matters when it comes to your finances.
John is is a British-born lapsed PhD physicist, who previously worked for Nasa on the Mars exploration team. He is a former commodity trading advisor with the US Commodities Futures Trading Commission, and worked in a boutique futures house in California in the 1980s.
He was a partner in one of the first futures newsletter advisory services, based in Washington DC, specialising in pork bellies and currencies. John is primarily a chart-reading trader, having cut his trading teeth in the days before PCs.
As well as his work in the financial world, he has launched, run and sold several 'real' businesses producing 'real' products.
-
 Average UK house price reaches £300,000 for first time, Halifax says
While the average house price has topped £300k, regional disparities still remain, Halifax finds.
-
 Barings Emerging Europe trust bounces back from Russia woes
Barings Emerging Europe trust has added the Middle East and Africa to its mandate, delivering a strong recovery, says Max King