In last Wednesday's post("Decision time in the FTSE100 chart"), and in last Monday's post ("Have I found the perfect FTSE sell signal?"), I laid out a case that the FTSE 100 index was about to drop. This morning, I have solid evidence that the process has now started.
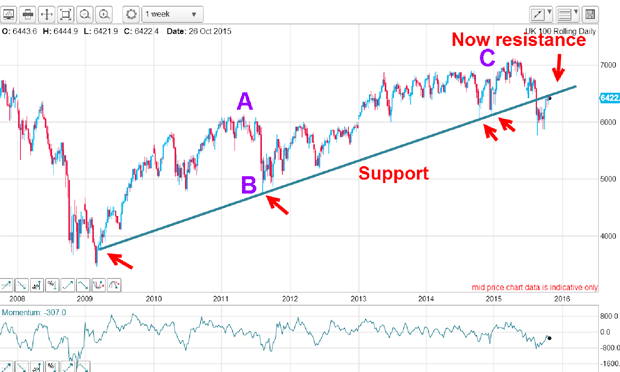
This is the monthly chart showing the six-year bull run off the 2009 lows. My six-year blue support line was breached back in August, but the market has now rallied back to it in a traditional kiss. If this kiss is genuine, the market should now start a scalded-cat bounce down and that outlook is right in line with my latest analysis.
The form of the rally is an A-B-C three-wave affair, and these patterns are always counter the one larger trend which is down:
Try 6 free issues of MoneyWeek today
Get unparalleled financial insight, analysis and expert opinion you can profit from.

Sign up to Money Morning
Don't miss the latest investment and personal finances news, market analysis, plus money-saving tips with our free twice-daily newsletter
Don't miss the latest investment and personal finances news, market analysis, plus money-saving tips with our free twice-daily newsletter
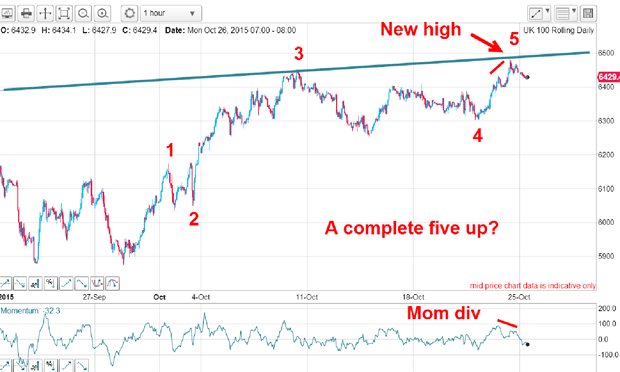
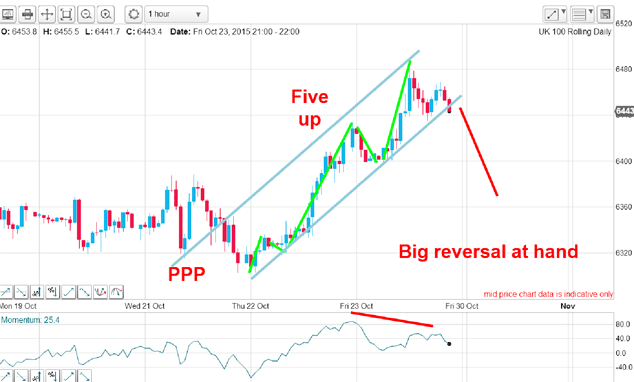
Last Monday, I also showed the FTSE on the hourly. I had a potentially complete five up and the market had just hit the major resistance line again on a momentum divergence. The odds were rapidly stacking up the rally high had been put in at the 6,490 level:

Then on Wednesday, I showed another hourly chart. The market had fallen back off my wave 5 high and was testing the pink line of support. I reckoned that if that line gave way , it was curtains for the rally.
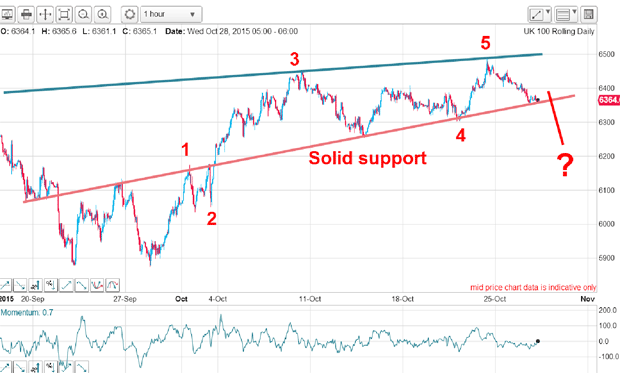
I wrote: "That pink line is my line in the sand".
My line in the sand has indeed been breached over the weekend. Incidentally, my chart has last week's data points missing in error, but my point remains.
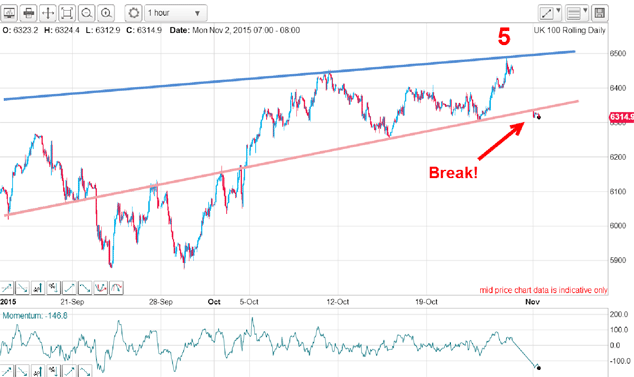
In fact, the rally to the wave 5 high also contained a clue that it had run its course. Below is the chart I took on Friday. From the Thursday low, I have a complete five up along a nice tramline pair and on a momentum divergence. In fact, all the ingredients were there for me to forecast a big reversal was at hand.
All is now falling into place for me to expect the scalded-cat bounce down. To confirm the downtrend has started, I need to see a particular pattern trace out on the short-term chart and I will cover that in a future post.