Have I found the perfect FTSE sell signal?
The charts suggest the FTSE 100 is on the verge of making a major move. John C Burford plots its course.
Get the latest financial news, insights and expert analysis from our award-winning MoneyWeek team, to help you understand what really matters when it comes to your finances.
You are now subscribed
Your newsletter sign-up was successful
Want to add more newsletters?

Twice daily
MoneyWeek
Get the latest financial news, insights and expert analysis from our award-winning MoneyWeek team, to help you understand what really matters when it comes to your finances.

Four times a week
Look After My Bills
Sign up to our free money-saving newsletter, filled with the latest news and expert advice to help you find the best tips and deals for managing your bills. Start saving today!
In yesterday's Sunday Times, I spotted an article headed: "I was scared of shares but I've just had to get over it".
It relates how a young woman finally became so frustrated by receiving so little interest on her savings that she has now overcome her fears of the stockmarket and taken the plunge. It took her over five years to reach this momentous decision and the FTSE increased by more than 100% in that time!
Notice that she felt forced to buy shares (against her better judgement?). This is not a generally recommended investment philosophy. And the fact that it featured on the front page of a newspaper is noteworthy.
MoneyWeek
Subscribe to MoneyWeek today and get your first six magazine issues absolutely FREE

Sign up to Money Morning
Don't miss the latest investment and personal finances news, market analysis, plus money-saving tips with our free twice-daily newsletter
Don't miss the latest investment and personal finances news, market analysis, plus money-saving tips with our free twice-daily newsletter
Investors and traders often act against their better judgement especially investors/traders who are relatively inexperienced.
Of course, my regular readers have learned how to fight this natural impulse and trade against it. Traders often make their best profits by fighting against mass sentiment and catching the market at a turn.
I think we're entering just such a situation at the moment. The FTSE has been on a mini bull run over the month or so. But I think it's about to hit resistance and begin a major move down.
The FTSE is testing a six-year trendline
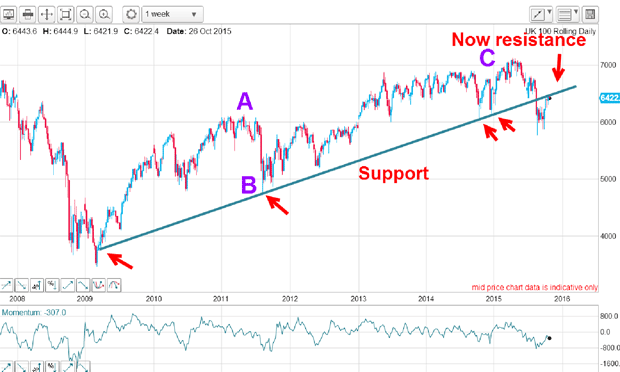
On Monday, I showed the multi-year chart with the very important trendline that started at the 2009 low. Here it is again on the monthly scale, with Elliott waves that best fit the 20092015 rally. Both the A and B waves are sporting their own internal five waves up. This count implies the next major move will be hard down:

Since 2009, the blue trendline has been a highly reliable line of support. Note the four accurate touch points marked by red arrows (if you pull up this chart yourself, you will see how very accurate these touch points are). And note that the first touch point in 2009 is not the absolute low. In my system, it is allowable to use the second low point after the absolute low as a touch point if it produces a better fit.
Following the trendline break in August, that line of support has become a line of resistance. Under this scenario, the market has entered a bear phase.
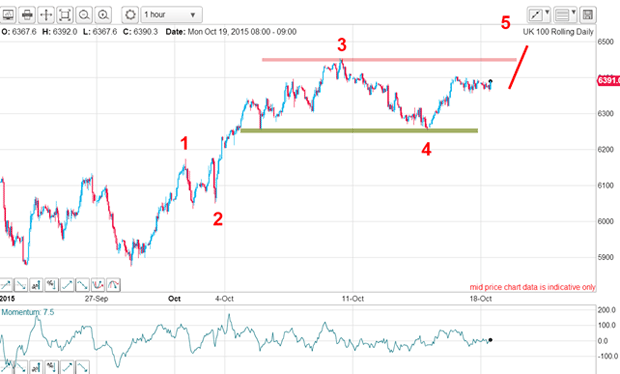
That observation allowed me to make this forecast last Monday on the hourly chart and is shown on the chart I showed then:

The latest rally is in the form of an incomplete five up with the market on Monday trading between the upper line of resistance and the lower line of support. I forecast last Monday that the market was poised to go on to make a new high in wave 5 to complete the rally.
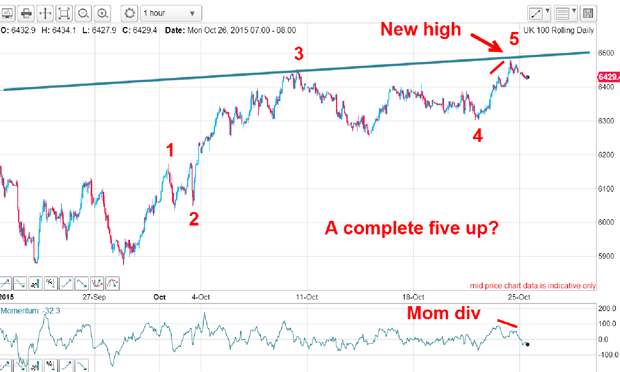
Below is the FTSE's position this morning. As I forecast, the market did make a new high in wave 5 and also planted a second kiss on the long-term trendline and with a momentum divergence:

To sum up the evidence this morning: the market is bouncing down off the trendline resistance, is in a fifth wave of a rally phase and there is a momentum divergence at last week's high. The odds are stacking up that a major high is here or hereabouts. But I cannot rule out a fifth wave extension to a new high just yet, so I am exercising a little caution here.
If this is correct, after a kiss comes a scalded-cat bounce as the market is repelled by the solid resistance. That move would help confirm that the top is in.
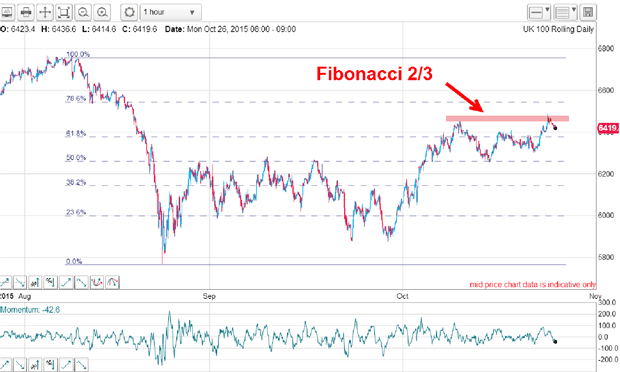
In addition, the market has just made a second hit on the Fibonacci 2/3 retrace of the big move down off the August high:

I have explained before how the 2/3 ratio is also a valid Fibonacci level as it combines the numbers 2 and 3 which appear consecutively in the Fibonacci sequence. It is not loaded on my platform, so I must work it out using my calculator an easy task.
The evidence is piling up, is it not? There is one more signal that could make up my mind - I will cover that in a later post.
Get the latest financial news, insights and expert analysis from our award-winning MoneyWeek team, to help you understand what really matters when it comes to your finances.
John is is a British-born lapsed PhD physicist, who previously worked for Nasa on the Mars exploration team. He is a former commodity trading advisor with the US Commodities Futures Trading Commission, and worked in a boutique futures house in California in the 1980s.
He was a partner in one of the first futures newsletter advisory services, based in Washington DC, specialising in pork bellies and currencies. John is primarily a chart-reading trader, having cut his trading teeth in the days before PCs.
As well as his work in the financial world, he has launched, run and sold several 'real' businesses producing 'real' products.
-
 UK interest rates live: experts expect MPC to hold rates
The Bank of England’s Monetary Policy Committee (MPC) meets today to decide UK interest rates. The last meeting resulted in a cut, but experts think there is little chance of interest rates falling today.
-
 MoneyWeek Talks: The funds to choose in 2026
Podcast Fidelity's Tom Stevenson reveals his top three funds for 2026 for your ISA or self-invested personal pension