The FTSE’s set to make a big move – but which way?
The FTSE 100 is caught between levels of support and resistance, says John C Burford. Expect a strong move when it breaks free.
Get the latest financial news, insights and expert analysis from our award-winning MoneyWeek team, to help you understand what really matters when it comes to your finances.
You are now subscribed
Your newsletter sign-up was successful
Want to add more newsletters?

Twice daily
MoneyWeek
Get the latest financial news, insights and expert analysis from our award-winning MoneyWeek team, to help you understand what really matters when it comes to your finances.

Four times a week
Look After My Bills
Sign up to our free money-saving newsletter, filled with the latest news and expert advice to help you find the best tips and deals for managing your bills. Start saving today!
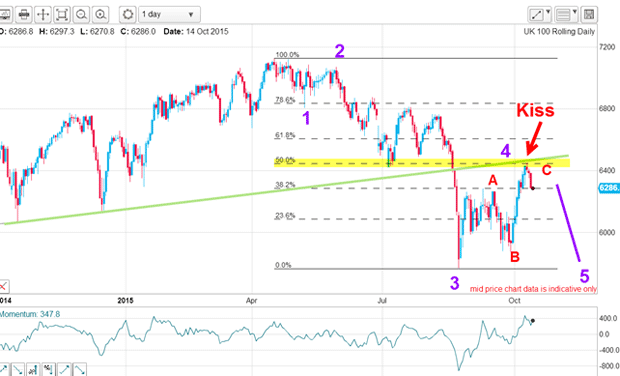
Last Wednesday, I covered the FTSE index and showed the multi-year tramline pair the market has been following. It was clear on the monthly chart that the market had rallied from the wave 3 low in wave 4.
The fourth wave was quite complex (as usual), but its overall shape corresponds to the classic A-B-C three-wave pattern with the market finishing up the C wave:

In the previous week, the market had hit the meeting of the Fibonacci 50% level and the underside of the tramline in a traditional kiss and that meeting represented strong resistance. So I had that kiss as the likely C wave (and wave 4) high where I could entertain the idea of going short.
MoneyWeek
Subscribe to MoneyWeek today and get your first six magazine issues absolutely FREE

Sign up to Money Morning
Don't miss the latest investment and personal finances news, market analysis, plus money-saving tips with our free twice-daily newsletter
Don't miss the latest investment and personal finances news, market analysis, plus money-saving tips with our free twice-daily newsletter
On the face of it, this appears the perfect setup. But today, I want to show you where the possible barriers to that decline lie on the chart and where I would advise caution.
When the market makes up its mind, it'll move hard
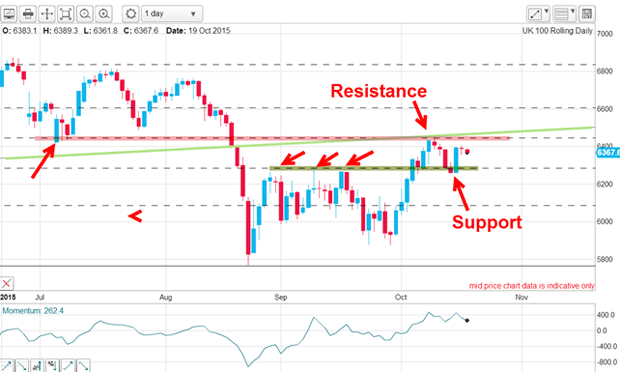
Chart support/resistance points often are present at the level of previous major highs and lows from past trading.
The July low was just such a significant support level, because the market turned at that point and markets have memories.

I always look for these support and resistance points by studying the chart history these give me likely turning points at a glance.
So, after hitting that combination of resistance levels (pink zone), the market declined. But look where the decline turned last week. I have marked that area by the green bar. This level marks chart support which was created by the September highs (three red arrows).
On a short-term basis then, this was solid resistance. Three attempts were made to overcome it, and failed every time.
Now I have a narrow zone contained between the pink and green bars of resistance and support.
This is valuable information! That is because we know that when the market breaks out of the zone, the move is likely to be solid.
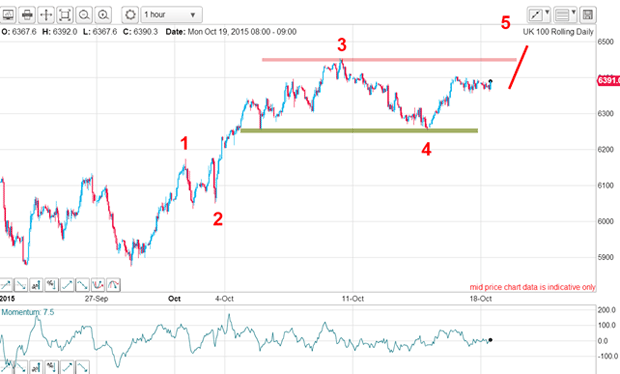
So here is my 'best guess' as to the market's progress. The wave pattern is shaping up to be a classic five up. Wave 2 is an A-B-C, while wave 3 is long and strong. Wave 4 is in a zig-zag stair-step decline, which suggests counter-trend. Just about all the elements are in place to back up this wave structure.

The odds now favour a punch up past the pink zone in the final fifth wave.
Of course, all trades need to be protected by a stop-loss and that is where my 3% rule comes in. For most small and medium sized accounts, I advise placing stops so that no more than 3% of your account size is put at risk. So even if you are unlucky to have six consecutive losses, your account balance will still end up around 80% of original and you can continue trading with the same bet size.
Get the latest financial news, insights and expert analysis from our award-winning MoneyWeek team, to help you understand what really matters when it comes to your finances.
John is is a British-born lapsed PhD physicist, who previously worked for Nasa on the Mars exploration team. He is a former commodity trading advisor with the US Commodities Futures Trading Commission, and worked in a boutique futures house in California in the 1980s.
He was a partner in one of the first futures newsletter advisory services, based in Washington DC, specialising in pork bellies and currencies. John is primarily a chart-reading trader, having cut his trading teeth in the days before PCs.
As well as his work in the financial world, he has launched, run and sold several 'real' businesses producing 'real' products.
-
 Can mining stocks deliver golden gains?
With gold and silver prices having outperformed the stock markets last year, mining stocks can be an effective, if volatile, means of gaining exposure
-
 8 ways the ‘sandwich generation’ can protect wealth
People squeezed between caring for ageing parents and adult children or younger grandchildren – known as the ‘sandwich generation’ – are at risk of neglecting their own financial planning. Here’s how to protect yourself and your loved ones’ wealth.