The five-year wave pattern driving the FTSE
John C Burford applies his tramlines to the multi-year chart of the FTSE 100 to see if the market is running out of steam.
Get the latest financial news, insights and expert analysis from our award-winning MoneyWeek team, to help you understand what really matters when it comes to your finances.
You are now subscribed
Your newsletter sign-up was successful
Want to add more newsletters?

Twice daily
MoneyWeek
Get the latest financial news, insights and expert analysis from our award-winning MoneyWeek team, to help you understand what really matters when it comes to your finances.

Four times a week
Look After My Bills
Sign up to our free money-saving newsletter, filled with the latest news and expert advice to help you find the best tips and deals for managing your bills. Start saving today!
For no apparent 'reason', stock indices have rallied in recent days. There has been no announcement of another round of quantitative easing (QE)from the Fed (although several pundits have suggested that option may well be on the table).
There has been no sudden lowering of interest rates (having been pinned to the floor for years, how much lower can they go?). And 'People's QE' as proposed by the Labour party (which would boost spending at a stroke) has not yet got off the drawing board.
The mediaseems to have found no logical' explanation so what has been driving stocks higher in the last few days?
MoneyWeek
Subscribe to MoneyWeek today and get your first six magazine issues absolutely FREE

Sign up to Money Morning
Don't miss the latest investment and personal finances news, market analysis, plus money-saving tips with our free twice-daily newsletter
Don't miss the latest investment and personal finances news, market analysis, plus money-saving tips with our free twice-daily newsletter
Powerful wave patterns have been driving the FTSE higher
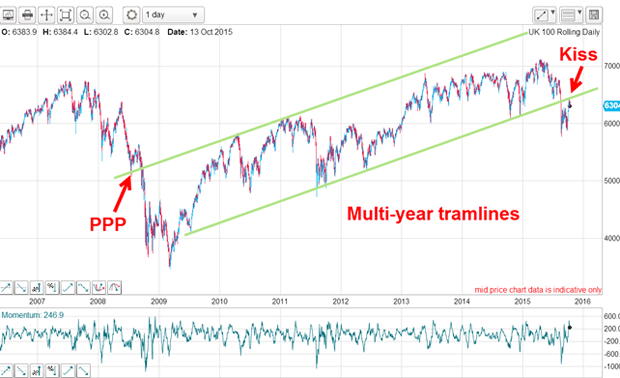
Below is the multi-year daily FTSE chart and I have drawn in a terrific tramline pair. The upper line has a prior pivot point (PPP) and several accurate touch points from 2011 and 2012. Since then, the market has not come close to touching that tramline an indication that the bull run has been running out of steam for several years.

In a healthy bull phase, markets make accurate touches of the upper tramline most of the way along it. There has not been such a touch point in the FTSE in almost five years. That is a very long time and has been a clear warning that the rally was on borrowed time.
Of course, the warning flags would have been cancelled if the market had possessed the strength to push up to the tramline, but that hasn't happened.
My terrific tramline pair was verified in August when the market finally broke below the lower tramline with force. And when the market rallied to plant a kiss on the underside of the tramline before falling away, I knew the tramline represented a strong line of resistance.
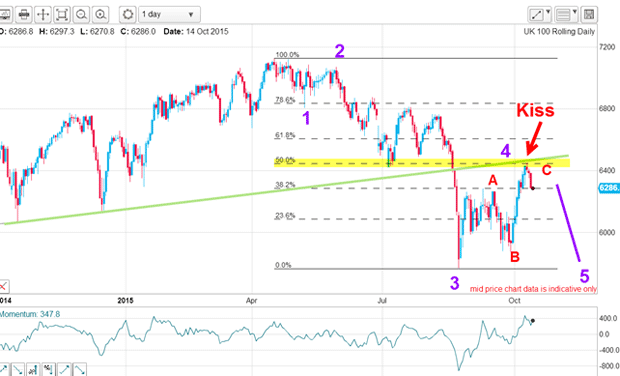
But the kiss did not just hit the resistance of the green tramline. It also hit the Fibonacci 50% retrace of the entire move down off the April high. Recall, the Fibonacci 50% level is one of the most common regions for a market turn.

What's more, the rally off the August plunge low is in a clear A-B-C pattern, which is always counter-trend.
Now we know what is driving the market higher the action of the C wave within wave 4 up.
Treat every trade like it's a loser
My Elliott wave labels show that when wave 4 ends, I expect a sharp move down in wave 5 to below the wave 3 low.
I now have a short trade working with a close stop. Will this be a winner? Many traders enter the world of trading expecting their closely-researched trades to win every time after all, they correctly followed all the rules. But experience soon teaches that trading is a percentage game some turn out to be winners and some losers, and it is impossible to say in advance which side of the ledger a trade will be written.
The odds can heavily favour your trade, but even 100-1 outsiders win horse races sometimes.
That is why it is best to enter every trade assuming it will be a loser. That way, you will faithfully observe all your trade and money management rules, such as my 3% and break even rules and help preserve capital. Get into the habit of husbanding your trading account and the winners will follow.
You see, entering a trade is the relatively easy part exiting it is far harder to judge. And that is where traders need to focus their studies rather than solely learning trade entry methods. Luckily, my tramline method covers both ends of the trade.
Get the latest financial news, insights and expert analysis from our award-winning MoneyWeek team, to help you understand what really matters when it comes to your finances.
John is is a British-born lapsed PhD physicist, who previously worked for Nasa on the Mars exploration team. He is a former commodity trading advisor with the US Commodities Futures Trading Commission, and worked in a boutique futures house in California in the 1980s.
He was a partner in one of the first futures newsletter advisory services, based in Washington DC, specialising in pork bellies and currencies. John is primarily a chart-reading trader, having cut his trading teeth in the days before PCs.
As well as his work in the financial world, he has launched, run and sold several 'real' businesses producing 'real' products.
-
 Can mining stocks deliver golden gains?
With gold and silver prices having outperformed the stock markets last year, mining stocks can be an effective, if volatile, means of gaining exposure
-
 8 ways the ‘sandwich generation’ can protect wealth
People squeezed between caring for ageing parents and adult children or younger grandchildren – known as the ‘sandwich generation’ – are at risk of neglecting their own financial planning. Here’s how to protect yourself and your loved ones’ wealth.