Decision time in the FTSE 100 charts
The FTSE 100 index has hit a solid line of support in the charts. Will it hold? John C Burford takes a closer look.
Get the latest financial news, insights and expert analysis from our award-winning MoneyWeek team, to help you understand what really matters when it comes to your finances.
You are now subscribed
Your newsletter sign-up was successful
Want to add more newsletters?

Twice daily
MoneyWeek
Get the latest financial news, insights and expert analysis from our award-winning MoneyWeek team, to help you understand what really matters when it comes to your finances.

Four times a week
Look After My Bills
Sign up to our free money-saving newsletter, filled with the latest news and expert advice to help you find the best tips and deals for managing your bills. Start saving today!
Later today, the Fed issues its monthly missive to the world, and most analysts will be poring over the runes for hints as to where interest rates are going. Previous announcements have been pretty tame affairs with no real surprises. But the day is approaching when the markets will get the news they are dreading rates are going up.
Of course, all sane people know that will happen at some point. Short-term rates have been stuck to the floor for several years now. But US economic data has been far from robust and seems to be getting weaker by the month. Just yesterday, Durable Goods, PMI Services Flash, Consumer Confidence and the Richmond Fed Manufacturing Index all came in under expectations (which were modest anyway). The trend of the past few months has been weakening economic growth.
One day, stockmarkets will stop looking at 'stimulus' as an excuse to load up on shares, and take note of the economy's tottering foundations.
MoneyWeek
Subscribe to MoneyWeek today and get your first six magazine issues absolutely FREE

Sign up to Money Morning
Don't miss the latest investment and personal finances news, market analysis, plus money-saving tips with our free twice-daily newsletter
Don't miss the latest investment and personal finances news, market analysis, plus money-saving tips with our free twice-daily newsletter
If companies' revenues and profits are falling, no amount of central bank 'stimulus' will turn them around it's like pushing on a string. Individuals and companies are already maxed out on their debt loads and when rates start rising, there will be even less incentive to take on more debt. In fact, junk debt issuance is now falling fast and ominously, defaults are rising as yields ratchet up. This trend will spill over into investment-grade debt and effectively shut the door on the Ponzi scheme which relies on an ever-expanding pool of liquidity (AKA debt) to keep all the balls in the air.
That is the scenario I am expecting if and when it happens, asset markets will crumble.
How to time a market collapse
I have long forecast a deflationary depression for the global economy. At least one half of this prediction is coming true the world is sliding into deflation (at least as measured by consumer prices). In the EU, 16 of the 28 member states were in deflation over the past 12months, and in the USA, prices did not increase at all. Supply has exceeded demand and central banks can't fix that.
So what about the depression? Greece, has been in it for some time. Portugal, Spain and Italy cannot be far behind with unemployment still at very high levels.
But the one true barometric measure of a looming depression is the stockmarket. It instantly responds to changes in social mood the driver of the economy. It takes hardly a second to buy or sell shares and that decision is driven by the mood of the trader/investor.
Economic decisions usually take weeks or months to have an impact on data (committees are involved!). And anyway, all economic data is backward-looking. By the time it is released, it may well be out of date and to base forecasts on this is akin to driving a car by only looking in the rear-view mirror.
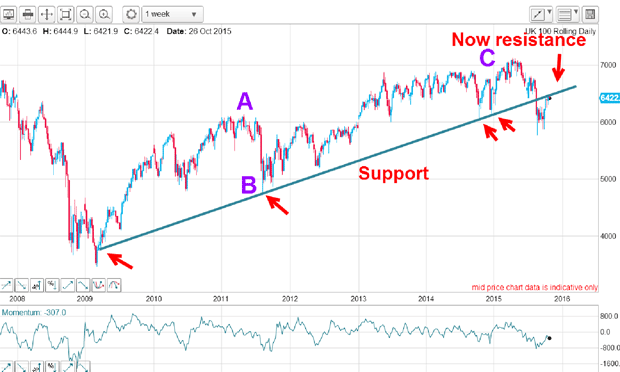
The market's testing my line of support it's crunch time
Have I found the perfect FTSE sell signal?
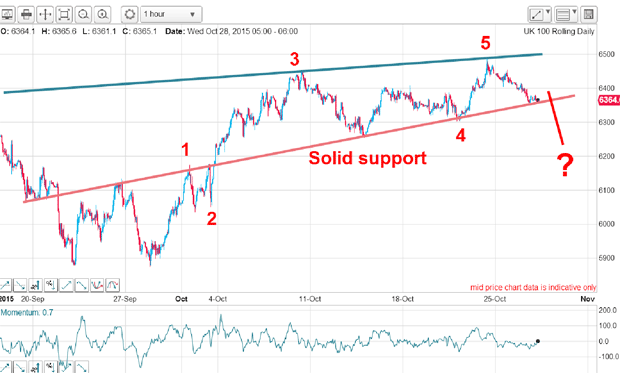
Below is the hourly short-term chart I showed on Monday. The solid blue line is the multi-year trendline from the 2009 low. It has been in place for six years as a reliable line of support (until it was breached in August when it became resistance). The market has therefore made it a very important feature and demanding of respect:

This month, the market has rallied to the underside of the line and has been rejected twice the second time being wave 5 of a five up from the late September low. That placed the rally in its terminal phase unless a monumentally powerful bid emerges to smash the market back up through the blue line.
Below is the chart as of this morning. The market is retreating from my wave 5 high and has hit the major short-term pink line of support with wave 1 as one of my prior pivot points (PPPs). Is this the start of the scalded-cat bounce down that normally follows a major trendline kiss?

As I wrote on Monday, "There is one more signal that could make up my mind I will cover that in a later post".That pink line is my line in the sand.
Get the latest financial news, insights and expert analysis from our award-winning MoneyWeek team, to help you understand what really matters when it comes to your finances.
John is is a British-born lapsed PhD physicist, who previously worked for Nasa on the Mars exploration team. He is a former commodity trading advisor with the US Commodities Futures Trading Commission, and worked in a boutique futures house in California in the 1980s.
He was a partner in one of the first futures newsletter advisory services, based in Washington DC, specialising in pork bellies and currencies. John is primarily a chart-reading trader, having cut his trading teeth in the days before PCs.
As well as his work in the financial world, he has launched, run and sold several 'real' businesses producing 'real' products.
-
 Barings Emerging Europe trust bounces back from Russia woes
Barings Emerging Europe trust has added the Middle East and Africa to its mandate, delivering a strong recovery, says Max King
-
 How a dovish Federal Reserve could affect you
Trump’s pick for the US Federal Reserve is not so much of a yes-man as his rival, but interest rates will still come down quickly, says Cris Sholto Heaton