The euro hits my target and rallies
The looming death of the euro is on everyone's lips. But that's when it can pay to go against the crowd, at least in the short-term. Timing is key - and John C Burford studies the charts to catch the rally.
Get the latest financial news, insights and expert analysis from our award-winning MoneyWeek team, to help you understand what really matters when it comes to your finances.
You are now subscribed
Your newsletter sign-up was successful
Want to add more newsletters?

Twice daily
MoneyWeek
Get the latest financial news, insights and expert analysis from our award-winning MoneyWeek team, to help you understand what really matters when it comes to your finances.

Four times a week
Look After My Bills
Sign up to our free money-saving newsletter, filled with the latest news and expert advice to help you find the best tips and deals for managing your bills. Start saving today!
Since my lastpost on the EUR/USD, we have had a few developments, to put it mildly!
The market has moved in my direction down and had on Friday got to within a whisker of my long-held target at 1.32.
I had been worrying over the small-scale Elliott wave count and predicted an A-B-C rally, which did materialise.
MoneyWeek
Subscribe to MoneyWeek today and get your first six magazine issues absolutely FREE

Sign up to Money Morning
Don't miss the latest investment and personal finances news, market analysis, plus money-saving tips with our free twice-daily newsletter
Don't miss the latest investment and personal finances news, market analysis, plus money-saving tips with our free twice-daily newsletter
The wave C high at the 1.36 level on 18 November was an ideal place to enter short trades.
The market really teed that one up nicely.
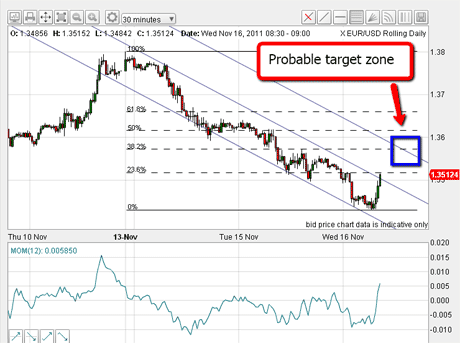
This was the situation on 16 November:

(Click on the chart for a larger version)
I had my upper target marked by the blue box and the wave C ended at the upper part of that box. Here is the updated chart:

(Click on the chart for a larger version)
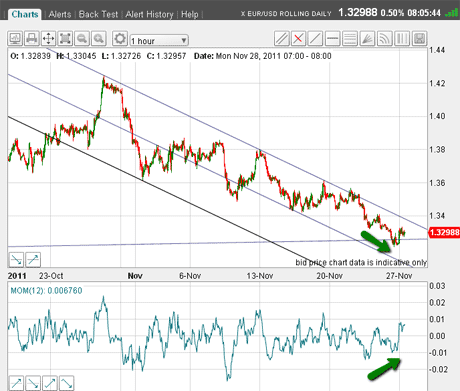
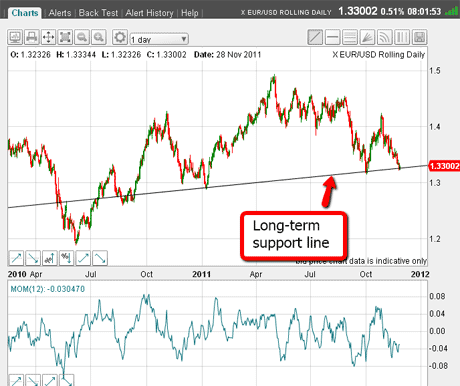
From that 1.36 high, the market declined to the 1.32 level last Friday note the positive momentum divergence marked by my green arrows. That was a juicy 400 pips gain in just a few days. Why was my long-held target at 1.32? Take a look at this longer-term daily chart:

(Click on the chart for a larger version)
Way back in early October, when the low was put in, I could draw in a support line and projected into the future, I could say that if the market dropped back, that support should hold.
As of this morning, we are seeing a bounce in its early stages off that support. That has validated my decision to take profits on my shorts.
One other reason to take profits is the fact that comment surrounding the euro has been overwhelmingly bearish. It has been bordering on an end-of-the-world scenario.
As you know, when markets get too one-sided, I see flashing warning lights. Very often, we see a sharp snap-back to shake out some weak shorts. These bear market rallies can be huge, so we must be on the alert here.
So what do I expect near-term as I write this early Monday morning?
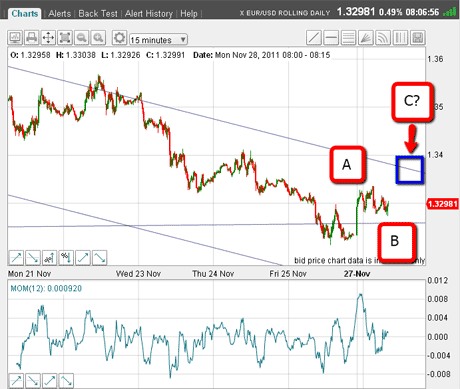
Here is the 15-min chart:

(Click on the chart for a larger version)
I have my tramline trio and overnight, the market is putting in its first up-move, which I have labeled a minor wave A. The small dip is my wave B, and if correct, I can expect a new high in my wave C. This should stop near my upper tramline, an area marked by my blue box.
That could be a good place for me to put out a short trade. But I may elect to take a very quick profit, if presented. Why?
Because that wave C may not be the end of this rally story! For one thing, it would be very small, compared with the decline off the 27 October 1.42 high. As I have said before, market patterns must "look right" to give me the confidence I need to trade off.
Also, knowing the market is very bearish is giving me considerable pause as is the fact that the market made my long-standing target on the major support at 1.32.
So, at present, my best guess is for my wave C to be put in, then a drop, but not to new lows under 1.32. Then, a bigger rally to perhaps the 1.34 1.35 area, where there is significant congestion resistance. That would be another great place to short.
Remember, trading is all about taking positions that offer great reward/risk profiles. Going against the crowd is usually the smarter move, but timing is (almost) everything, and that is why I spend such effort in analysing the charts using the methods I show here.
The market is being driven primarily by the various eurozone bailout schemes being proposed. How the market views the credibility of these schemes will determine how far the rallies extend. But don't write off the possibility that the euro can come back from the dead!
If you're a new reader, or need a reminder about some of the methods I refer to in my trades, then do have a look at my introductory videos:
Advanced trading with Elliott waves
An introduction to Elliott wave theory
The essentials of tramline trading
Don't miss my next trading insight. To receive all my spread betting blog posts by email, as soon as I've written them, just sign up here .
Get the latest financial news, insights and expert analysis from our award-winning MoneyWeek team, to help you understand what really matters when it comes to your finances.
John is is a British-born lapsed PhD physicist, who previously worked for Nasa on the Mars exploration team. He is a former commodity trading advisor with the US Commodities Futures Trading Commission, and worked in a boutique futures house in California in the 1980s.
He was a partner in one of the first futures newsletter advisory services, based in Washington DC, specialising in pork bellies and currencies. John is primarily a chart-reading trader, having cut his trading teeth in the days before PCs.
As well as his work in the financial world, he has launched, run and sold several 'real' businesses producing 'real' products.
-
 UK interest rates live: experts expect MPC to hold rates
The Bank of England’s Monetary Policy Committee (MPC) meets today to decide UK interest rates. The last meeting resulted in a cut, but experts think there is little chance of interest rates falling today.
-
 MoneyWeek Talks: The funds to choose in 2026
Podcast Fidelity's Tom Stevenson reveals his top three funds for 2026 for your ISA or self-invested personal pension