Using Elliott waves to trade the euro
John C Burford uses an excellent Elliott wave pattern to help him time his entry and exit points in this trade in the euro.
Get the latest financial news, insights and expert analysis from our award-winning MoneyWeek team, to help you understand what really matters when it comes to your finances.
You are now subscribed
Your newsletter sign-up was successful
Want to add more newsletters?

Twice daily
MoneyWeek
Get the latest financial news, insights and expert analysis from our award-winning MoneyWeek team, to help you understand what really matters when it comes to your finances.

Four times a week
Look After My Bills
Sign up to our free money-saving newsletter, filled with the latest news and expert advice to help you find the best tips and deals for managing your bills. Start saving today!
On Monday, I showed that the euro vs the dollar was declining to a point where it could challenge a tramline. I said: "A break through this tramline would be bearish, I believe, and short sales could be made in this event."
After writing that, the break did occur at the 1.37 level and since then, the market has declined further to this morning's low (so far) of 1.3450.
All through this decline, I have been making my Elliott wave counts. Why do I do this? Simply because when a fifth wave appears, I can expect a sharp rebound - often in an A-B-C pattern.
MoneyWeek
Subscribe to MoneyWeek today and get your first six magazine issues absolutely FREE

Sign up to Money Morning
Don't miss the latest investment and personal finances news, market analysis, plus money-saving tips with our free twice-daily newsletter
Don't miss the latest investment and personal finances news, market analysis, plus money-saving tips with our free twice-daily newsletter
So, when I am short-term trading, I will look to take profits on my shorts when I suspect the fifth wave has been completed. Then, ideally, I will look to short again near the top of wave C, where the decline should resume.
But this is a lot easier said than done, as is everything in real-time trading!
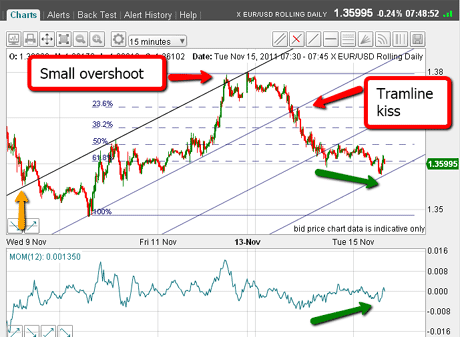
Here is the chart as of yesterday morning after the 1.37 level had been breached:

(Click on the chart for a larger version)
Trader tip: Note the typical tramline 'kiss' after the break. This is usually an excellent place to short if you missed the original break. But be aware that these kisses do not appear at every tramline break! You may be left without a position in a potentially very profitable trade.
Because the kiss had confirmed my tramline placement was reliable, I was then able to draw the other two tramlines in.
If you would like to see how I use my tramline trading methods, see my video tutorial: The essentials of tramline trading.
The market has set up for a very possible reversal here. I can count an excellent five-wave Elliott pattern complete with a long and strong third wave. The market had reached my fourth tramline precisely, and there was a potential positive momentum divergence (marked by green arrows).
A larger wave
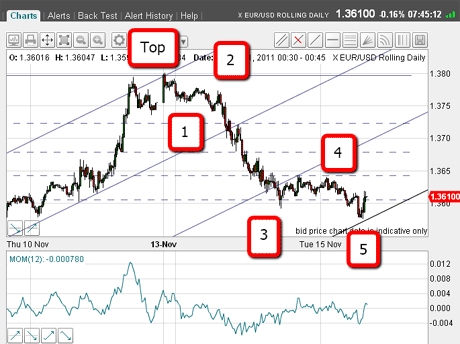
This is about ideal as it gets. Here is a closer look:

(Click on the chart for a larger version)
But this is where it gets interesting. I know from experience that my initial labelling of waves 3, 4, and 5 could be correct, but could be part of a larger pattern.
In other words, my initial wave 5 could be a larger-scale wave 3, leading to a new wave 4, and then a new wave 5 which would occur at lower levels, where more profit awaits.
Trader tip: When you believe you are in a third wave and making a fourth wave, you must allow for the possibility that the subsequent fifth wave may not be the final low prior to a large reversal! There may be more profit on the table.
Of course, my nature told me to take profits when the market reached the fourth tramline at the 1.3580 area for a quick 120 pips profit.
A more conservative approach would be to place a protect-profit stop just above the initial wave 4. That would enable you to profit from any further declines, if they were to occur.
The drawback is that if the market rallied past your stop, that would reduce your profit on this trade. As ever, it is horses for courses.
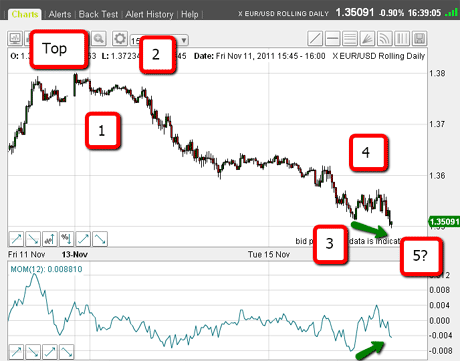
This is the chart as of yesterday afternoon:

(Click on the chart for a larger version)
I have drawn in my new waves 3, 4 and 5. Again, there is a potential positive momentum divergence (green arrows). And again, this would have been a logical place to take short-term profits.
The rally begins
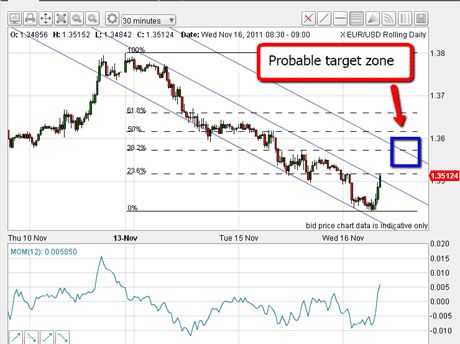
But look what has happened since then. Here is the chart as I write:

(Click on the chart for a larger version)
The fifth wave extended even further down to this morning's 1.3450 low, and now I can draw in a new set of down-sloping tramlines containing all trading since the 1.38 top.
This morning's low just touched the lower tramline, and now the market is pushing above the centre tramline.
This is the start of the counter-trend bounce I have been waiting for.
I have drawn in my Fibonacci levels (to see how I use Fibonacci, see my video tutorial: Trading with Fibonacci levels.
I hope to see an A-B-C pattern on this rally, and my initial target for my C-wave high is where the 36% retrace meets my upper tramline.
This would be an excellent place to consider a short sale.
But the background is febrile, and I constantly expect very sharp rallies in this bear market. All it would take to get one is for the unthinkable to happen, such as an announcement that the European Central Bank is to stand behind all of the eurozone debt. Also, the market has a bearish bias another cause for caution!
That is why I advise short-term trading for now. In the meantime, I am content to take short-term profits from the swings.
If you're a new reader, or need a reminder about some of the methods I refer to in my trades, then do have a look at my introductory videos:
The essentials of tramline trading
An introduction to Elliott wave theory
Don't miss my next trading insight. To receive all my spread betting blog posts by email, as soon as I've written them, just sign up here .
Get the latest financial news, insights and expert analysis from our award-winning MoneyWeek team, to help you understand what really matters when it comes to your finances.
John is is a British-born lapsed PhD physicist, who previously worked for Nasa on the Mars exploration team. He is a former commodity trading advisor with the US Commodities Futures Trading Commission, and worked in a boutique futures house in California in the 1980s.
He was a partner in one of the first futures newsletter advisory services, based in Washington DC, specialising in pork bellies and currencies. John is primarily a chart-reading trader, having cut his trading teeth in the days before PCs.
As well as his work in the financial world, he has launched, run and sold several 'real' businesses producing 'real' products.
-
 Average UK house price reaches £300,000 for first time, Halifax says
While the average house price has topped £300k, regional disparities still remain, Halifax finds.
-
 Barings Emerging Europe trust bounces back from Russia woes
Barings Emerging Europe trust has added the Middle East and Africa to its mandate, delivering a strong recovery, says Max King