The euro hits my Fibonacci target - where to now?
After the euro rallied to his Fibonacci target, John C Burford looks to the charts to see where the market thinks the single currency is heading next.
Get the latest financial news, insights and expert analysis from our award-winning MoneyWeek team, to help you understand what really matters when it comes to your finances.
You are now subscribed
Your newsletter sign-up was successful
Want to add more newsletters?

Twice daily
MoneyWeek
Get the latest financial news, insights and expert analysis from our award-winning MoneyWeek team, to help you understand what really matters when it comes to your finances.

Four times a week
Look After My Bills
Sign up to our free money-saving newsletter, filled with the latest news and expert advice to help you find the best tips and deals for managing your bills. Start saving today!
Before I cover the euro, here are a few recent article titles on gold that I spotted:
The Argument For Cheaper Gold Protect Yourself From Gold How Low Can Gold Go?
These bearish articles would not have seen the light of day until very recently. It just goes to show the severe shift in sentiment from manic bullishness to deep bearishness that has overcome the market as it plunged to the $1,320 low last week.
MoneyWeek
Subscribe to MoneyWeek today and get your first six magazine issues absolutely FREE

Sign up to Money Morning
Don't miss the latest investment and personal finances news, market analysis, plus money-saving tips with our free twice-daily newsletter
Don't miss the latest investment and personal finances news, market analysis, plus money-saving tips with our free twice-daily newsletter
As a trader, you can use this information to your advantage. This is part of your sentiment-gathering work in addition to looking at the commitments of traders data and elsewhere that I strongly advise you to do as part of your market analysis.
This sentiment switch helped me to identify a major low last week, and if we see many more such articles, my fanciful' upside target above $1,500 that I suggested last week may not be so crazy.
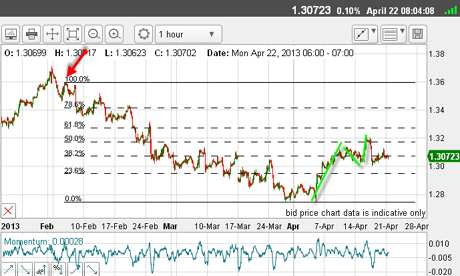
OK, back to the euro. When I last covered it on 15 April, I was looking for an A-B-Crally off the 4 April low. This is the picture this morning:

(Click on the chart to see a larger version)
Although not picture-perfect, the rally has an A-B-C form (green bars) with the C wave top above the A wave top.
I have drawn in the Fibonacci retrace levels using the first rally high after the 1.37 top (red arrow).
This brings up an interesting point when choosing which pivot points to use when applying your Fibonacci tool on retracements.
Trader tip: I have found that after a relatively long move, such as we saw in February and March, it is good to look at the Fibonacci levels when drawn from either the top, or the next major top after that main top is in place.
Rally retraces can turn at either of these levels.
Two nasty head fakes
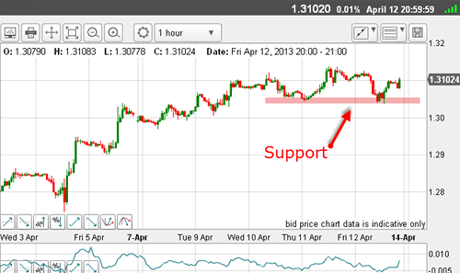
Also, last time, I had the 1.3050 region as support:

(Click on the chart to see a larger version)
And I said that if this support could be broken, that would strengthen the case for a resumption of the down move.
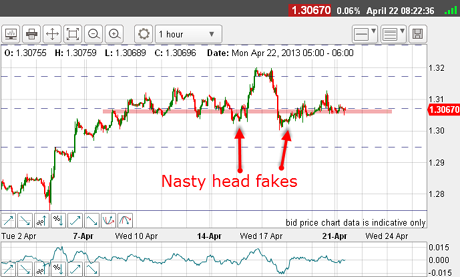
But the market played one of its many tricks the support was broken, but the market recovered and went on to the 1.32 top. It then declined past the 1.3050 level and gave one more head fake:

(Click on the chart to see a larger version)
Naturally, if short positions were taken on these support breaks, you would be in a losing trade and you may be stopped out, depending on your stop position.
These are the trials and tribulations of trading. But by using a strict money management rule, such as my 3% rule, you will not suffer unduly.
And if stopped out, you have the option of getting back in if conditions warrant it. Just keep updating your charts with tramlines and Fibonacci levels and you may be presented with another trade.
And so it has proved.
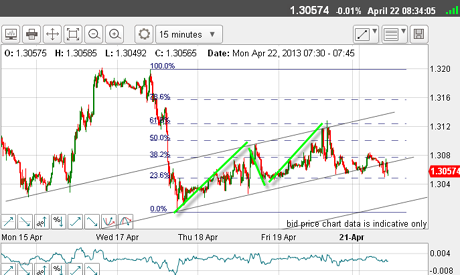
But what does the short-term picture tell me? Here is the current 15-minute chart:

(Click on the chart to see a larger version)
Here, we have the sharp move down off the 1.32 high, and then an excellent A-B-C rally (green bars), which took the market right to the exact Fibonacci 50% retrace.
Remember, the A-B-C form gives support to the idea that the main trend is down, of course.
That is the crucial information these A-B-C patterns give. This means that the odds favour trading from the short side.
This chart is looking much more textbook!
And the C wave high near 1.3120 was the place to re-enter shorts, if stopped out previously.
Also, I have drawn in my excellent tramlines, with the upper line possessing three terrific prior pivot points (PPPs) on the left side of the chart.
As I write, the lower line is on the verge of being broken. This is also a great place to enter shorts at low risk. Protective stops can be placed just above the most recent minor high in the1.3080 area.
Be your own pundit
| Contracts of €125,000 | Row 0 - Cell 1 | Row 0 - Cell 2 | Row 0 - Cell 3 | Open interest: 215,657 | ||||
| Commitments | ||||||||
| 49,321 | 79,085 | 5,758 | 121,372 | 76,858 | 176,451 | 161,701 | 39,206 | 53,956 |
| Changes from 13/11/12 (Change in open interest: 14,368) | ||||||||
| 13,978 | -7,116 | 225 | -20,322 | 4,370 | -6,119 | -2,521 | 1,423 | -2,175 |
| Percent of open in terest for each category of traders | ||||||||
| 22.9 | 36.7 | 2.7 | 56.3 | 35.6 | 81.8 | 75.0 | 18.2 | 25.0 |
| Number of traders in each category (Total traders: 354) | ||||||||
| 39 | 64 | 26 | 46 | 45 | 99 | 121 | Row 8 - Cell 7 | Row 8 - Cell 8 |
In this market, the question is always, are the hedgies in love with the euro, or out of love with the dollar? Or both?'
An enormous amount of writing is devoted to analysing this question. But I prefer to examine the charts and sentiment myself.
If there is one piece of advice that can benefit all traders, it is this: cut down on reading opinion and analysis' pieces. Do your own analysis I guarantee it will be much better than most of what you read!
OK, so the market is telling us that it wants to move lower perhaps to my lower tramline just above the 1.30 area.
Short-term traders will be eyeing this level to take at least partial profits.
But longer-term traders will be looking at the previous major low in the 1.28 area as a viable target.
If you're a new reader, or need a reminder about some of the methods I refer to in my trades, then do have a look at my introductory videos:
The essentials of tramline trading Advanced tramline trading An introduction to Elliott wave theory Advanced trading with Elliott waves Trading with Fibonacci levels Trading with 'momentum' Putting it all together
Don't miss my next trading insight. To receive all my spread betting blog posts by email, as soon as I've written them, just sign up here . If you have any queries regarding MoneyWeek Trader, please contact us here.
Get the latest financial news, insights and expert analysis from our award-winning MoneyWeek team, to help you understand what really matters when it comes to your finances.
John is is a British-born lapsed PhD physicist, who previously worked for Nasa on the Mars exploration team. He is a former commodity trading advisor with the US Commodities Futures Trading Commission, and worked in a boutique futures house in California in the 1980s.
He was a partner in one of the first futures newsletter advisory services, based in Washington DC, specialising in pork bellies and currencies. John is primarily a chart-reading trader, having cut his trading teeth in the days before PCs.
As well as his work in the financial world, he has launched, run and sold several 'real' businesses producing 'real' products.
-
 Average UK house price reaches £300,000 for first time, Halifax says
While the average house price has topped £300k, regional disparities still remain, Halifax finds.
-
 Barings Emerging Europe trust bounces back from Russia woes
Barings Emerging Europe trust has added the Middle East and Africa to its mandate, delivering a strong recovery, says Max King