Can the euro go higher?
Since the end of March, the euro has been in a steady climb. Is the market now ripe for a change of direction? Using his charting methods as a guide, John C Burford makes his latest trade.
Get the latest financial news, insights and expert analysis from our award-winning MoneyWeek team, to help you understand what really matters when it comes to your finances.
You are now subscribed
Your newsletter sign-up was successful
Want to add more newsletters?

Twice daily
MoneyWeek
Get the latest financial news, insights and expert analysis from our award-winning MoneyWeek team, to help you understand what really matters when it comes to your finances.

Four times a week
Look After My Bills
Sign up to our free money-saving newsletter, filled with the latest news and expert advice to help you find the best tips and deals for managing your bills. Start saving today!
Many commodities fell sharply on Friday, including gold, silver, copper and crude oil.
And that collapse is continuing on Monday morning as I write.
I will cover the euro today, as it is showing the rally strength that I suggested in my last post of 27 March.
MoneyWeek
Subscribe to MoneyWeek today and get your first six magazine issues absolutely FREE

Sign up to Money Morning
Don't miss the latest investment and personal finances news, market analysis, plus money-saving tips with our free twice-daily newsletter
Don't miss the latest investment and personal finances news, market analysis, plus money-saving tips with our free twice-daily newsletter
Later in the week I hope to cover gold, which is collapsing as longs' liquidate their positions.
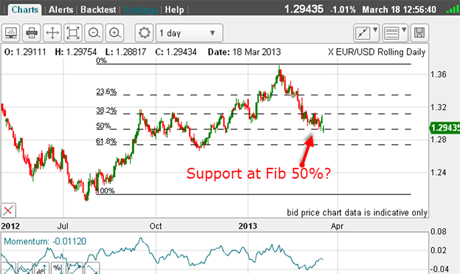
Inthat post, I wondered whether the Fibonacci 50% level would hold:
(Click on the chart for a larger version)
The market did decline a little further, but did not fall as far as the next 62% level before staging a vigorous rally.
Recently I wrote: "But if the market can rise to the 1.2850 level, where there lie the minor highs, there could be much short-covering; enough to propel the market above the fourth wave high at the 1.29 area."
This would be a sensible place to enter.
And here is the hourly chart:
(Click on the chart for a larger version)
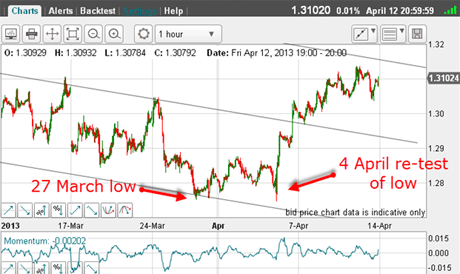
On the day of my post, 27 March, the market made a low at the 1.2750 level and then rallied over the next few days. Then it re-tested the low on 4 April.
But that was it from there the market took off like a scalded cat, breaking through my centre tramline towards my upper tramline.
Excellent entry levels were presented all the way up, as my forecast for much short-covering above the minor highs played out.
OK, we are now trading at the 1.31 level, and so the question is: is there any more upward potential in the near term?
A clear Elliot wave pattern
(Click on the chart for a larger version)
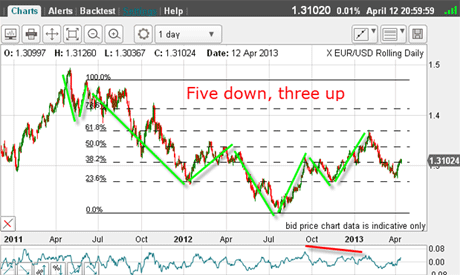
This is the action over past two years, and in that period, we see a clear five down, three up pattern. This implies the larger trend is down, once the short-term rallies have exhausted.
The A-B-C since last summer also sports a small negative-momentum divergence (red bar) and the C wave topped out at precisely the Fibonacci 62% retrace. Naturally, that was a great place to enter shorts.
In terms of Elliott waves and Fibonaccis, the picture really doesn't get much clearer than this.
Therefore, the odds favour a resumption of the downtrend at some point to below the last summer's lows.
But what are other traders doing? Here is latest commitments of traders (COT) data:
| OPEN INTEREST: 220,353 | ||||||||
| COMMITMENTS | ||||||||
| 35,343 | 86,201 | 5,533 | 141,694 | 72,488 | 182,570 | 164,222 | 37,783 | 56,131 |
| CHANGES FROM 04/02/13 (CHANGE IN OPEN INTEREST: -15,518) | ||||||||
| -9,116 | -23,959 | -482 | -6,224 | 8,789 | -15,822 | -15,652 | 304 | 134 |
| PERCENT OF OPEN INTEREST FOR EACH CATEGORY OF TRADERS | ||||||||
| 16.0 | 39.1 | 2.5 | 64.3 | 32.9 | 82.9 | 74.5 | 17.1 | 25.5 |
| NUMBER OF TRADERS IN EACH CATEGORY (TOTAL TRADERS: 171) | ||||||||
| 39 | 58 | 21 | 44 | 44 | 93 | 113 | Row 8 - Cell 7 | Row 8 - Cell 8 |
There is one thing about short squeezes. They often precede a turn down, since the forced buying eventually dries up.
Pinpointing the market turn
(Click on the chart for a larger version)
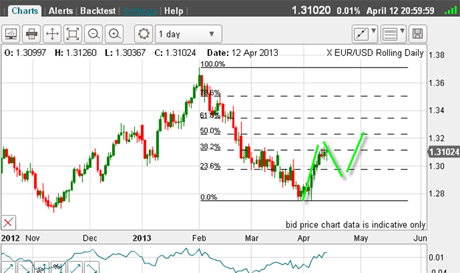
Already the rally has retraced a Fibonacci 38% of the decline off the 1.37 high, so this is a potential reversal point.
And if the complete rally is to be another A-B-C, which appears likely, then we should see a dip to the B wave low, and then a rally to a new high in the C wave perhaps to the Fibonacci 50% retrace in the 1.3350 area.
Or, the A wave may extend further from here, before dipping in the B wave.
There really is no reliable method to forecast which will prevail but with momentum already in lofty territory, a pull-back looks to be a little more likely.
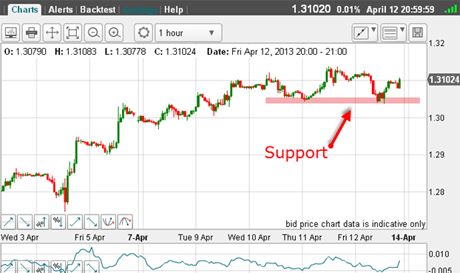
Here is a closer look:
(Click on the chart for a larger version)
The 1.3050 area is now good support. As long as the market can hold above it, the rally is still on.
But if the market breaks this support, a further decline is on the cards.
With my long trade working, the sensible place to move my protect-profit stop is just under the pink bar. I may even decide to reverse position and go short there, looking for a deep pull-back in the possible B wave.
And if the market decided to continue its climb, I am still long and will look to exit at a higher level.
This situation is ideal for using my split bet strategy. If the market rallies perhaps to the previously mentioned 1.3350 area I can take a profit on one half of my position, and keep the other half running, while moving my protect-profit stop up on this position.
This allows for the chance to make an even larger profit on my second-half position. The worst case is that I take a slightly smaller profit than on the first half.
How liquidity links markets
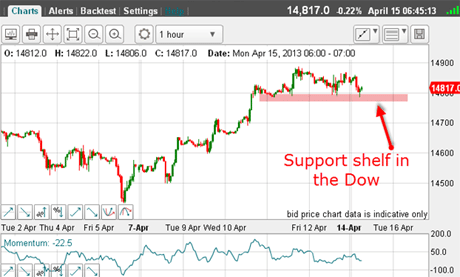
(Click on the chart for a larger version)
It shows the support shelf which will act in the same way as in the euro.
This matching of the euro and the Dow is entirely rational,since the financial markets are being driven by changes in liquidity available for speculation.
Recently, the link between the dollar and the Dow has weakened, but with the industrial commodities (and precious metals) in freefall indicating a massive reduction in liquidity I expect the link to be re-established.
If you're a new reader, or need a reminder about some of the methods I refer to in my trades, then do have a look at my introductory videos:
The essentials of tramline trading Advanced tramline trading An introduction to Elliott wave theory Advanced trading with Elliott waves Trading with Fibonacci levels Trading with 'momentum' Putting it all together
Don't miss my next trading insight. To receive all my spread betting blog posts by email, as soon as I've written them, just sign up here . If you have any queries regarding MoneyWeek Trader, please contact us here.
Get the latest financial news, insights and expert analysis from our award-winning MoneyWeek team, to help you understand what really matters when it comes to your finances.
John is is a British-born lapsed PhD physicist, who previously worked for Nasa on the Mars exploration team. He is a former commodity trading advisor with the US Commodities Futures Trading Commission, and worked in a boutique futures house in California in the 1980s.
He was a partner in one of the first futures newsletter advisory services, based in Washington DC, specialising in pork bellies and currencies. John is primarily a chart-reading trader, having cut his trading teeth in the days before PCs.
As well as his work in the financial world, he has launched, run and sold several 'real' businesses producing 'real' products.
-
 MoneyWeek Talks: The funds to choose in 2026
Podcast Fidelity's Tom Stevenson reveals his top three funds for 2026 for your ISA or self-invested personal pension
-
 Three companies with deep economic moats to buy now
Opinion An economic moat can underpin a company's future returns. Here, Imran Sattar, portfolio manager at Edinburgh Investment Trust, selects three stocks to buy now