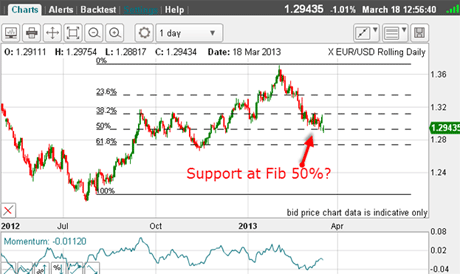
On Monday, I noted that because of worries over the integrity of the eurozone, the euro weakened to the crucial Fibonacci 50% level. This was the daily chart then:
(Click on the chart for a larger version)
It had declined by seven cents in two months and had resulted in a very low momentum reading, down to thelevel where previous lows had been made since last summer. This is note-worthy. It was another clue that some sort of bounce was likely.
Try 6 free issues of MoneyWeek today
Get unparalleled financial insight, analysis and expert opinion you can profit from.

Sign up to Money Morning
Don't miss the latest investment and personal finances news, market analysis, plus money-saving tips with our free twice-daily newsletter
Don't miss the latest investment and personal finances news, market analysis, plus money-saving tips with our free twice-daily newsletter
But with the Cyprus banking drama playing out, this has put added bearish sentiment onto the euro. So should the bulls give up?

Let's examine the picture this morning.
(Click on the chart for a larger version)
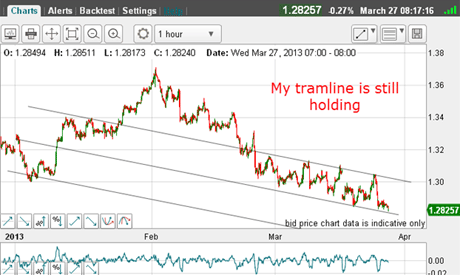
These are my previous tramlines. After Monday's flirtation with the upper line to close the gap from 18 March - the market quickly sank to the centre line.
All I can say at this point is that the short-term downtrend is intact, but the 50% Fibonacci support level has not been broken yet.
Note the form of the decline off the January 1.37 high. It is very choppy' meaning that there are big overlaps between the minor waves. A new low is made, and then the market retraces a large part of that down wave before gunning for another new low.
And there are large 150-pip-plus rallies in between.
This pattern is repeated all the way down.
When you see this, it as a likely sign of corrective behaviour. It is not characteristic of impulse waves, which move rapidly in one direction.
It seems as though the market is giving ground grudgingly in the face of overwhelming bearish sentiment...
and when I see that, my contrarian instinct emerges and I look for a long trade!
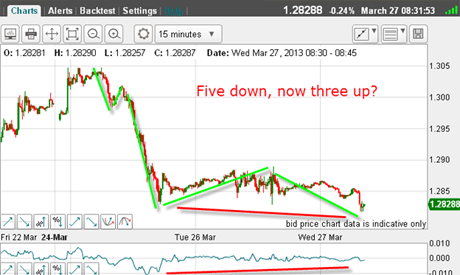
So let's zoom in and see the short-term picture:
(Click on the chart for a larger version)
What an interesting picture! We have five clear waves down with a strong wave 3, a complex wave 4 (a common feature of fourth waves), a new low in wave 5 and a huge potential positive-momentum divergence.
This is straight out of the Elliott wave textbook!
So now I am looking for a correction up.
Of course, I could just enter here and put a close stop in case the market wants to move down to the daily Fibonacci 62% support at the 1.27 area.
But if the market can rise to the 1.2850 level, where there lie the minor highs, there could be much short-covering; enough to propel the market above the fourth wave high at the 1.29 area.
This would be a sensible place to enter.
What kind of relief rally?
So what is the potential move for any relief rally? After all, we need to get a handle on a target to judge whether our proposed trade makes sense.
Because the Fibonacci 50% level on the daily chart is so critical for support, any move up should be quite strong.
Also, with the negative influence of Cyprus in the market, has the market discounted all of the bad news?
This is always a value judgment the only real clue we have is to read the press. If all is gloom and doom and you read lots of dire predictions for euro contagion, that is usually near a low.
And my tramlines are of high quality, as I explained last time.
My guess is that if a rally can be mounted, it should carry back to my upper tramline, at least. So there are at least 200 pips potentially available.
But longer-term, the trend is down, so this would be a counter-trend trade, and over-staying your welcome is not advisable!
However, if the market can rise above my upper tramline, that would set the cat amongst the pigeons!
There are many political developments in both the euro and the US dollar imminent, which will impact the cross rate, but one of the great features of currency trading is that trends do persist often for much longer than one can imagine.
Since last year, the US dollar has been rallying in the face of previous gloomy predictions for it, as central banks crank up the money supplies. But hyper-inflation has not appeared, and short-sellers have been forced to buy back their short dollar positions as it rallied.
With the hedgies massively on the short euro side (see Commitments of Traders (COT) data last time) will they get caught out again?
If you're a new reader, or need a reminder about some of the methods I refer to in my trades, then do have a look at my introductory videos:
The essentials of tramline trading
An introduction to Elliott wave theory
Advanced trading with Elliott waves
Don't miss my next trading insight. To receive all my spread betting blog posts by email, as soon as I've written them, just sign up here . If you have any queries regarding MoneyWeek Trader, please contact us here.