The euro bounces off major support
Despite the drama in Cyprus, the euro has refused to break - that can only mean one thing, says John C Burford. With the charts for a guide, here he assesses the risks of his next trade.
Get the latest financial news, insights and expert analysis from our award-winning MoneyWeek team, to help you understand what really matters when it comes to your finances.
You are now subscribed
Your newsletter sign-up was successful
Want to add more newsletters?

Twice daily
MoneyWeek
Get the latest financial news, insights and expert analysis from our award-winning MoneyWeek team, to help you understand what really matters when it comes to your finances.

Four times a week
Look After My Bills
Sign up to our free money-saving newsletter, filled with the latest news and expert advice to help you find the best tips and deals for managing your bills. Start saving today!
table.ben-table table { border: 1px solid #2b1083;font: verdana, arial, sans-serif; }
th { background: #2b1083; padding: 2px 1px;color: white;font-weight: bold;text-align: center;border-left: 1px solid #a6a6c9; font-size: .8em;}th.first { border-left: 0; padding: 2px 1px;text-align: left; font-size: .8em;}
tr {background: #fff;}
MoneyWeek
Subscribe to MoneyWeek today and get your first six magazine issues absolutely FREE

Sign up to Money Morning
Don't miss the latest investment and personal finances news, market analysis, plus money-saving tips with our free twice-daily newsletter
Don't miss the latest investment and personal finances news, market analysis, plus money-saving tips with our free twice-daily newsletter
tr.alt {background: #f6f5f9; }
td { padding: 2px 1px;text-align: center;border-left: 1px solid #a6a6c9;color: #000;vertical-align: center; font-size: .8em;}td.alt { background-color: #f6f5f9; }
td.bold { font-weight: bold;}td.first { text-align: left; }
td.left { text-align: left; }
I'm afraid a gremlin crept into Friday's post, where the heading was: The Dow has turned. It should have read: Has the Dow turned?
It is a fact that all forecasts are probabilistic, and a definite statement like that can only be made well after the fact when moving averages are conforming. As it happened, the Dow had not turned! I shall get to it hopefully later this week.
But this morning, I want to cover the euro, as it is springing to life in the light of developments in Cyprus.
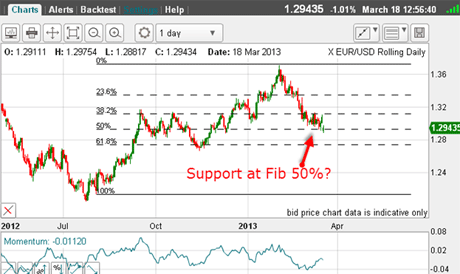
In mypost of 18 March, I was watching and waiting for further developments on the charts. One clue that the down move off the February 1.37 high was about to turn was the 1.2850 level, which the market had hit, was a precise 50% Fibonacci retrace of the big move up. This was the chart then:

(Click on the chart for a larger version)
The Cyprus news last Monday had produced a gap lower to the 1.2850 level, and that had given rise to the break of my lower tramline but was it a genuine break?
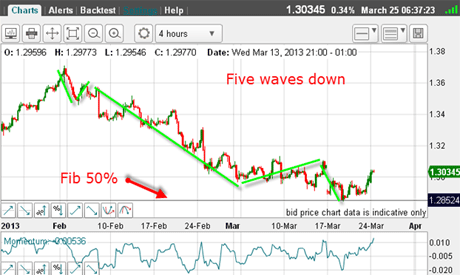
Let us examine the move off the 1.37 high, as that might give me clues about the moves ahead.

(Click on the chart for a larger version)
I can count a credible five-wave pattern! It obeys all of Elliott's rules with my fifth and final wave ending at the Fibonacci 50% level.
That means I can expect a rally of some sort hopefully in an A-B-C form.
Three superb pivot points
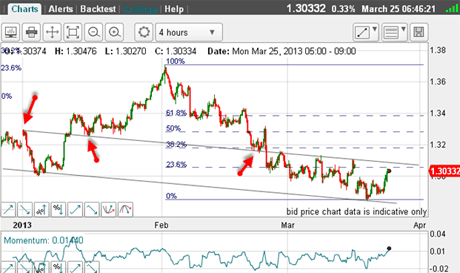
Time to produce the Fibonacci levels on the down move and see where my tramlines now sit.

(Click on the chart for a larger version)
My upper tramline sports three superb prior pivot points (PPPs - red arrows), making it as secure a line as I have seen. They really do not get much better than this.
The first PPP goes right back to early January on this hourly chart, making it of added significance. Remember, markets have long memories.
This morning, the market is pressing the Fibonacci 23% level with my tramline lying just above.
So, was there an opportunity for a low-risk trade since last Monday to take advantage of this budding rally?
Naturally, it is always good to check the Commitments of Traders (COT) data to discover any imbalances between bulls and bears. Here is the latest set as of 19 March:
| OPEN INTEREST: 195,073 | ||||||||
| COMMITMENTS | ||||||||
| 48,958 | 93,842 | 5,562 | 102,319 | 44,157 | 156,839 | 143,561 | 38,234 | 51,512 |
| CHANGES FROM 03/12/13(CHANGE IN OPEN INTEREST: -18,040) | ||||||||
| -8,515 | 11,582 | -2,139 | -2,590 | -24,832 | -13,244 | -15,389 | -4,796 | -2,651 |
| PERCENT OF OPEN INTEREST FOR EACH CATEGORY OF TRADERS | ||||||||
| 25.1 | 48.1 | 2.9 | 52.5 | 22.6 | 80.4 | 73.6 | 19.6 | 26.4 |
| NUMBER OF TRADERS IN EACH CATEGORY (TOTAL TRADERS: 168) | ||||||||
| 24 | 79 | 21 | 41 | 37 | 79 | 123 | Row 8 - Cell 7 | Row 8 - Cell 8 |
You can see that the hedgies (non-commercials) are about two-to-one in the bear camp, but during the week, had swung massively to that side. They had reduced their longs and increased their shorts by a wide margin.
The analysts sold right at the low
And this snapshot was taken on the 19th, just as the market made its 1.2850 low! How about that?
So the hedge funds, who are predominantly trend followers, had greatly increased their short bets right at the low.
But we have all done it until we learn how to read the markets in finer detail.
You might think that because the funds are run by very smart and well-paid analysts, we, as minnows, would be at a severe disadvantage when trying to out-fox them.
But because they tend to herd and that is a whole subject I may cover later they are predictable.
And nowhere is this truer than at market turns.
Trader tip: Keep an eye on the COT and sentiment data for your market, if available. It can tell you a lot more than reading the gurus.
So there we have some fuel to propel the market much higher as the funds must cover if the market moves higher against them.
The key area to watch is my upper tramline in the 1.31 region. If that can be broken, the odds favour a move to the Fibonacci 50% level at around 1.33.
So let's back up and see where we could have traded last week.
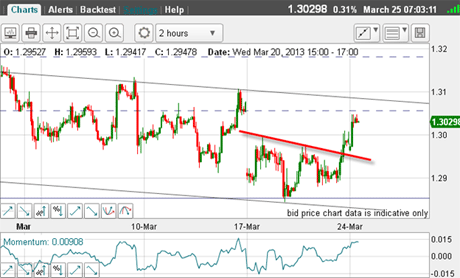
Here is a closer look at last week's action:

(Click on the chart for a larger version)
One possible trade of course was at the 1.2850 low and relies on the lower tramline to hold. Many would consider that very high risk bottom fishing, in fact.
But with a 50 to 60-pip stop, I consider that a low-risk trade. If stopped out, it meant that the tramline was definitely broken and the odds would shift to lower prices.
The other area to trade was a break of the red bar which joined the tops of the minor highs, where you would suspect many buy-stops to lurk, placed there by nervous shorts.
Why nervous? Simply because the talk last week was of risk of contagion from Cyprus with massive flight out of euros. What more bearish picture could be painted? Yet the market refused to break.
And when the obvious' move does not occur, odds are that the opposite will occur. And that is where you come in as a trader who recognises what is going on and is nimble enough to take advantage.
Also, you would glance over and see the big gap from last Monday and reckon that the gap might well get filled as the immediate path. A protective stop just under the mid-week dip would be sensible. That would be a 60 to 80-pip risk again.
There were several sensible trading entries last week.
OK, this morning, we have an emerging rally, but so far, the pattern is a 1-2-3 up, which could turn out to be an A-B-C correction. And the market remains between the tramlines, as I pointed out last time.
I still regard the upper tramline as my line in the sand.
If you're a new reader, or need a reminder about some of the methods I refer to in my trades, then do have a look at my introductory videos:
The essentials of tramline trading
An introduction to Elliott wave theory
Advanced trading with Elliott waves
Don't miss my next trading insight. To receive all my spread betting blog posts by email, as soon as I've written them, just sign up here . If you have any queries regarding MoneyWeek Trader, please contact us here.
Get the latest financial news, insights and expert analysis from our award-winning MoneyWeek team, to help you understand what really matters when it comes to your finances.
John is is a British-born lapsed PhD physicist, who previously worked for Nasa on the Mars exploration team. He is a former commodity trading advisor with the US Commodities Futures Trading Commission, and worked in a boutique futures house in California in the 1980s.
He was a partner in one of the first futures newsletter advisory services, based in Washington DC, specialising in pork bellies and currencies. John is primarily a chart-reading trader, having cut his trading teeth in the days before PCs.
As well as his work in the financial world, he has launched, run and sold several 'real' businesses producing 'real' products.
-
 Can mining stocks deliver golden gains?
With gold and silver prices having outperformed the stock markets last year, mining stocks can be an effective, if volatile, means of gaining exposure
-
 8 ways the ‘sandwich generation’ can protect wealth
People squeezed between caring for ageing parents and adult children or younger grandchildren – known as the ‘sandwich generation’ – are at risk of neglecting their own financial planning. Here’s how to protect yourself and your loved ones’ wealth.