The euro extends its rally – for now
The euro has continued its rally - but for how long? John C Burford goes in search of an elusive market-top that could be the key to the answer.
Get the latest financial news, insights and expert analysis from our award-winning MoneyWeek team, to help you understand what really matters when it comes to your finances.
You are now subscribed
Your newsletter sign-up was successful
Want to add more newsletters?

Twice daily
MoneyWeek
Get the latest financial news, insights and expert analysis from our award-winning MoneyWeek team, to help you understand what really matters when it comes to your finances.

Four times a week
Look After My Bills
Sign up to our free money-saving newsletter, filled with the latest news and expert advice to help you find the best tips and deals for managing your bills. Start saving today!
We've been looking at the EUR/USD a lot lately. It's a fascinating market right now.
Next week, I'll aim to cover another market and it should start with the Dow on Monday.
Today, though, I want to stay with the euro and show you my latest analysis.
MoneyWeek
Subscribe to MoneyWeek today and get your first six magazine issues absolutely FREE

Sign up to Money Morning
Don't miss the latest investment and personal finances news, market analysis, plus money-saving tips with our free twice-daily newsletter
Don't miss the latest investment and personal finances news, market analysis, plus money-saving tips with our free twice-daily newsletter
It illustrates an important principle while I attempt to understand the market's position vis vis the Elliott wave and tramline structure.
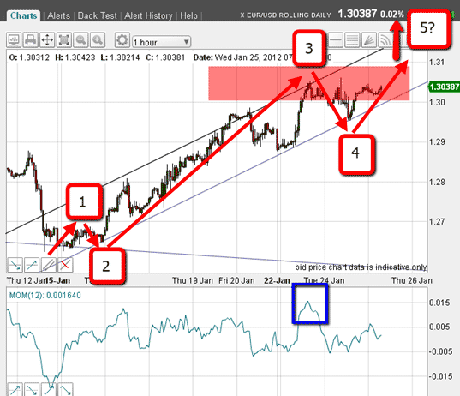
Recall from Wednesday that I had drawn in my best effort at identifying the Elliott wave and tramline structures in the rally off the mid-January low. This is the chart I showed then:

(Click on the chart for a larger version)
I was not entirely happy with my label for the fifth wave, as the market had not made a clear high above wave 3. But I was giving it the benefit of the doubt.
Fed announcement sends the euro to new highs
Since writing that post, though, the market dipped below the lower tramline, and then rallied strongly to a new high yesterday (see next chart below). This was the clear new high I was hoping for, courtesy of the Fed.
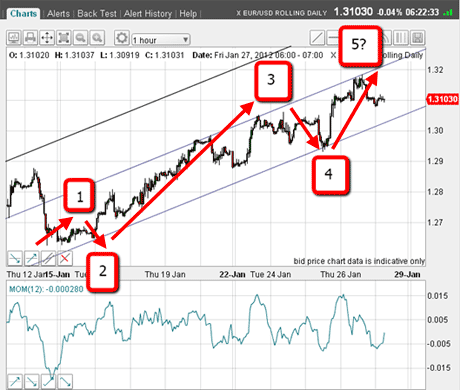
Looking at it now, this could be my fifth wave to complete this part of the rally segment.
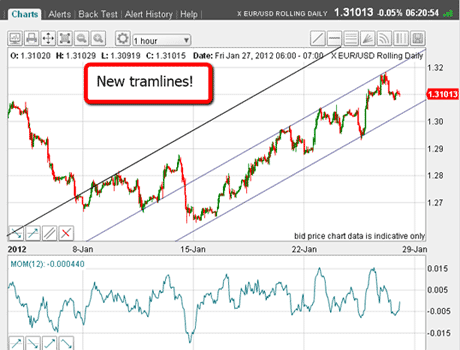
So I looked for a new set of tramlines and this is the result:

(Click on the chart for a larger version)
Right away, these are much more satisfactory than the previous pair.
This is the perfect illustration of an important trading principle. That is, how it's necessary to keep your eyes open for possibly better tramline placements.
I started with the centre tramline, which took in the 11 January low as well as the highs.
My parallel line below gratifyingly took in the two major lows and then my third upper tramline touches the 9 and 10 January highs.
Altogether, this is much better. Now I have a more certain Elliott wave labelling, as marked in my next chart. My new 4th wave is now the Wednesday low.

(Click on the chart for a larger version)
Note that my fifth wave rallied right to the centre tramline, and is backing off as I write. That was an ideal place to take profits on long positions, and possibly establish new short positions.
Trader tip: It is infinitely easier to find the best tramlines and Elliott wave labels on old charts than it is in real time at least, it is for me. The best you can do is to use what information you have at the time and make your best guess. If later trading action forces you to make changes so be it. Always pencil in your lines and labels and have your eraser handy.
Why the euro could decline in the short term
So, if my labels are correct, I can expect a decline, at least to the lower tramline in a probable A-B-C pattern. We already have a budding A and B wave forming as I write.
I believe more downside action is on the cards for the euro, though. This 550-pip rally has taken some froth off the extreme bearishness evident at the 16 January lows. But the market appears poised for a resumption of the downtrend for now at least.
But I shall be watching for signs of basing action likely centred around a Fibonacci retracement level. I will be placing my Fibonacci levels over the chart very soon.
I'll be back next week with more chart analysis. Don't miss it.
If you're a new reader, or need a reminder about some of the methods I refer to in my trades, then do have a look at my introductory videos:
The essentials of tramline trading
An introduction to Elliott wave theory
Advanced trading with Elliott waves
Don't miss my next trading insight. To receive all my spread betting blog posts by email, as soon as I've written them, just sign up here .
Get the latest financial news, insights and expert analysis from our award-winning MoneyWeek team, to help you understand what really matters when it comes to your finances.
John is is a British-born lapsed PhD physicist, who previously worked for Nasa on the Mars exploration team. He is a former commodity trading advisor with the US Commodities Futures Trading Commission, and worked in a boutique futures house in California in the 1980s.
He was a partner in one of the first futures newsletter advisory services, based in Washington DC, specialising in pork bellies and currencies. John is primarily a chart-reading trader, having cut his trading teeth in the days before PCs.
As well as his work in the financial world, he has launched, run and sold several 'real' businesses producing 'real' products.
-
 ISA fund and trust picks for every type of investor – which could work for you?
Whether you’re an ISA investor seeking reliable returns, looking to add a bit more risk to your portfolio or are new to investing, MoneyWeek asked the experts for funds and investment trusts you could consider in 2026
-
 The most popular fund sectors of 2025 as investor outflows continue
It was another difficult year for fund inflows but there are signs that investors are returning to the financial markets