The euro rallies – but where to now?
The euro's strong rally will have come as a shock to many traders. But not to experienced chartists who saw it coming - and made hefty profits, says John C Burford. So, where is the euro heading now?
Get the latest financial news, insights and expert analysis from our award-winning MoneyWeek team, to help you understand what really matters when it comes to your finances.
You are now subscribed
Your newsletter sign-up was successful
Want to add more newsletters?

Twice daily
MoneyWeek
Get the latest financial news, insights and expert analysis from our award-winning MoneyWeek team, to help you understand what really matters when it comes to your finances.

Four times a week
Look After My Bills
Sign up to our free money-saving newsletter, filled with the latest news and expert advice to help you find the best tips and deals for managing your bills. Start saving today!
Since early this month I have forecast a sharp rally in the EUR/USD. My view was formed by the technical picture and you can read my analysis in previous posts:The mostimportant chart of the year so far,and most recently, Is the euro nowin a bull market?
But now the rally is underway, more and more pundits are jumping on the bandwagon. Hindsight is a wonderful thing, but no-one makes money trading it!
Recall from mypost on 4 January, The ultimate contrarian trade to kick off 2012,the euro had precious few friends. To most traders, going long the euro then was considered suicidal.
MoneyWeek
Subscribe to MoneyWeek today and get your first six magazine issues absolutely FREE

Sign up to Money Morning
Don't miss the latest investment and personal finances news, market analysis, plus money-saving tips with our free twice-daily newsletter
Don't miss the latest investment and personal finances news, market analysis, plus money-saving tips with our free twice-daily newsletter
If I were trading on the fundamentals', I would be scratching my head trying to understand what has happened since!
But now the EUR/USD is rallying, going long does not seem so crazy for technical traders, like myself. Naturally, when the majority believe in the euro again as they will that will be the time to reverse.
How to spot a low-risk entry
One of the keys to successful swing trading is to be able to identify a low-risk entry. That means getting in very close to the low (or high if you're going short). That way, close protective stops can be set, limiting risk.
At these points, it seems you are trading against the trend, which is usually discouraged. But by following my methods, where I use tramlines, Elliott waves, and Fibonacci, I am able to identify some of these low-risk entries.
Of course, there are other excellent methods out there that can accomplish this, and I would encourage any trader to investigate them.
Every successful trader I know has found and developed a method that works for them. No two traders use a system in exactly the same way. You must find and adapt a method that suits you and sometimes, that can mean going down a few blind alleys first.
OK, now let's have some fun.
The euro could be setting up for a major rally
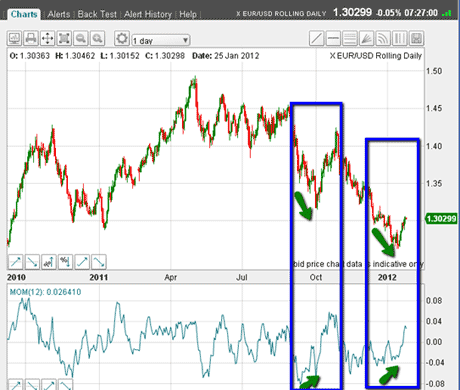
Take a look at this daily chart of the EUR/USD:

(Click on the chart for a larger version)
Is it possible that the market can extend its current rally more substantially?
We have seen a 400-pip rally so far. The blue box on the left contains the October 1,000-pip rally off the positive momentum divergence (green arrows).
But look at the right-hand blue box here we also have a rally coming off a positive momentum divergence.
Can history repeat? If so, then if we get a similar-sized rally this time, my target would be in the 1.36 1.37 zone. Talk about a home run!
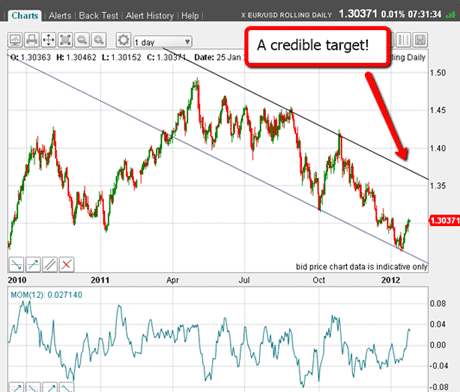
OK, now take a look at this daily chart:

(Click on the chart for a larger version)
I have drawn in my tramline pair which contains several excellent touch-points. If the market can make it to my upper tramline, that target would be in the same 1.36 area.
Hmmm. This is getting interesting.
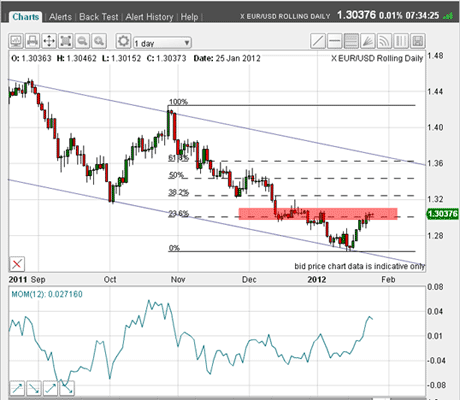
So where are we this morning? You can see on this expanded daily chart:

(Click on the chart for a larger version)
I can see that the rally has carried right to the Fibonacci 23% retrace. It's now trading in the chart resistance zone marked by the thick red bar. This zone is where there was congestion on the way down in late December.
I would expect at least some pause here, and possibly a top, if the market so decides.
Check out this text book Elliott wave pattern
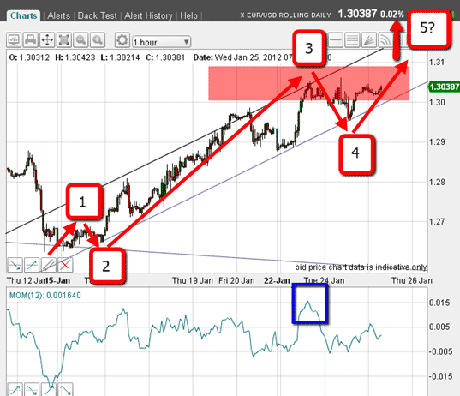
But now take a look at the hourly chart, which shows the form of the rally:

(Click on the chart for a larger version)
This is a magnificent example of a textbook Elliott wave structure.
First, I can count five clear waves three up and two down with the final fifth wave still to be made. The third wave was "long and strong" with high momentum a textbook case.
Second, all waves are contained within my tramlines with excellent touch-points.
They really don't come any better than this.
Also, can you count a clear five waves within wave 3? That is yet another perfect third wave structure.
OK, we know what should happen after the fifth wave is put in a three-wave decline. So that is what I expect in the next few hours.
Look out for the Fed announcement later today
But of course, this upward five-wave pattern is telling me that the major trend has turned up (for now). That would set the cat amongst the pigeons, as the majority are still bearish and are shorting into this rally.
Interestingly, we have a much-anticipated Fed announcement later today (5.30pm UK time)and this news could induce the moves I am expecting.
One of the key markets I keep my eye on is the US Treasuries and the T-Bonds have taken a tumble recently, reflecting the recent move out of risk-off positions. Sadly, there is no rolling T-Bond market, so I watch the future the March contract is available to trade currently.
If T-Bond yields continue to rise, then the implications for the US economy are very negative, and would likely spike the nascent recovery that has got the stock market excited.
The Fed has been the major buyer of the T-Bonds recently, so any change in policy would have a severe impact. That could really move the EUR/USD.
But if my fantasy' target of the 1.36 area is to gain traction, I need to see a move up to my first long-standing target of 1.32 for my first home run.
But I am now on second base and that was inconceivable in December.
If you're a new reader, or need a reminder about some of the methods I refer to in my trades, then do have a look at my introductory videos:
The essentials of tramline trading
An introduction to Elliott wave theory
Advanced trading with Elliott waves
Don't miss my next trading insight. To receive all my spread betting blog posts by email, as soon as I've written them, just sign up here .
Get the latest financial news, insights and expert analysis from our award-winning MoneyWeek team, to help you understand what really matters when it comes to your finances.
John is is a British-born lapsed PhD physicist, who previously worked for Nasa on the Mars exploration team. He is a former commodity trading advisor with the US Commodities Futures Trading Commission, and worked in a boutique futures house in California in the 1980s.
He was a partner in one of the first futures newsletter advisory services, based in Washington DC, specialising in pork bellies and currencies. John is primarily a chart-reading trader, having cut his trading teeth in the days before PCs.
As well as his work in the financial world, he has launched, run and sold several 'real' businesses producing 'real' products.
-
 Average UK house price reaches £300,000 for first time, Halifax says
While the average house price has topped £300k, regional disparities still remain, Halifax finds.
-
 Barings Emerging Europe trust bounces back from Russia woes
Barings Emerging Europe trust has added the Middle East and Africa to its mandate, delivering a strong recovery, says Max King