The ultimate contrarian trade to kick off 2012
With so many bears circling the beleaguered euro, is the single currency preparing a devastating comeback? John C Burford looks to the charts for clues.
Get the latest financial news, insights and expert analysis from our award-winning MoneyWeek team, to help you understand what really matters when it comes to your finances.
You are now subscribed
Your newsletter sign-up was successful
Want to add more newsletters?

Twice daily
MoneyWeek
Get the latest financial news, insights and expert analysis from our award-winning MoneyWeek team, to help you understand what really matters when it comes to your finances.

Four times a week
Look After My Bills
Sign up to our free money-saving newsletter, filled with the latest news and expert advice to help you find the best tips and deals for managing your bills. Start saving today!
In the first of my emails of the new year, I have decided to cover the EUR/USD.
This market is in the cross-hairs of most people and many traders have already pulled the trigger. As my colleague, John Stepek, remarked yesterday, bearishness is rampant on the outlook for the single currency.
You only have to read the comments sections of financial articles appearing in the press many of which are very aggressive in tone to the poor currency to conclude that the euro has few friends.
MoneyWeek
Subscribe to MoneyWeek today and get your first six magazine issues absolutely FREE

Sign up to Money Morning
Don't miss the latest investment and personal finances news, market analysis, plus money-saving tips with our free twice-daily newsletter
Don't miss the latest investment and personal finances news, market analysis, plus money-saving tips with our free twice-daily newsletter
Many expect the demise of the euro in at least one of the eurozone countries, if not several. As a result, they expect the euro to continue weakening.
This is not the place for speculating on the euro's life chances. Such speculation is out of place in my brief.
But to gain an insight into how "crowded the short euro trade" is (as John mentioned), let's look at the Commitments of Traders latest report.
Recall, this report gives accurate data into the breakdown of the various trading sectors, according to their holdings of long and short futures contracts. This is where people put their money where their mouths are.
This is the data as of 27 December:
| Hedge funds (large) | 45,000 | 173,000 |
| Small traders | 25,000 | 54,000 |
| Speculators (total) | 70,000 | 228,000 |
| Commercial (banks, etc) | 204,000 | 47,000 |
So the speculators are 3.2:1 on the short side. Commercials (the strong hands) are overwhelmingly long. With such a disparity, the ship is listing dangerously!
Not only that, but the hedge funds increased their short positions by a net 14,000 as the market moved below the critical $1.30 level.
This is just like gold's set-up in summer 2011
Does this situation remind you of anything?
It should, as an identical set-up occurred in gold in the summer when the market was making its $1,900 an ounce high, prior to the huge declines (which I traded, incidentally and I'll have another email on gold very soon).
That was a classic case of herding and I took full advantage by trading the opposite side.
As a generally contrarian trader, my eyebrows do tend to lift when I see such a situation develop in any market.
Why? It's simple. Whatever view I may have on the currency and the politics and economics of it and I confess I am agnostic here if the market can get a small rally going, it could well develop into a massive counter-trend move as the huge number of shorts are squeezed (forced to buy back their positions as their losses mount). That's a real possibility.
As noted above, we recently saw this process occur in gold, but in reverse, as the overweight longs were forced to liquidate as the selling pressure spread like wildfire. The falls were heart-stopping for many over-leveraged longs who arrived late to the party.
These are happy hunting grounds for contrarian traders.
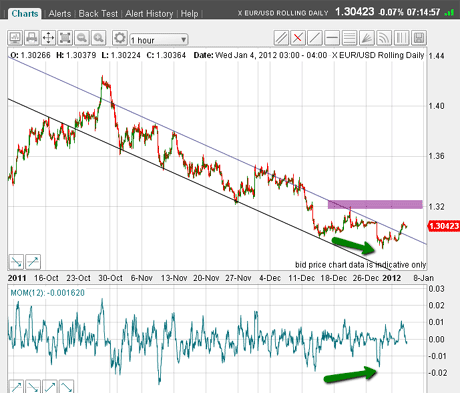
So what are the charts telling me this morning? Here is the hourly chart:

(Click on the chart for a larger version)
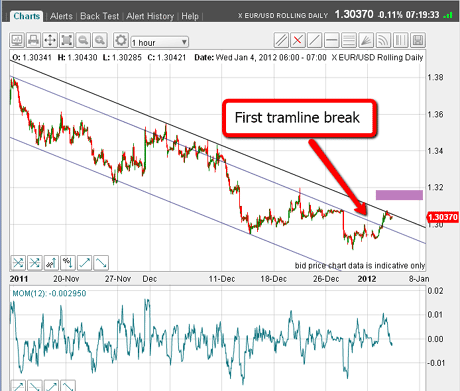
I have drawn my tramlines which are not textbook off the late October 1.42 high. Yesterday, the market moved off the 1.3050 low (with a small positive momentum divergence marked by green arrows) and also moved through my upper tramline. This is the first clue that we may be looking at a more substantial rally ahead. Here is a closer look:

(Click on the chart for a larger version)
The early December highs, which lie above my first upper tramline, are bothering me, so I have drawn a satellite tramline across these highs and the market currently is challenging that as I write.
The purple bars are areas that can be used to take long positions (say using buy-stop orders). If the market can push up to these bars, that would be the second clue that I am looking for.
The ultimate contrarian trade for 2012?
So is it possible that here at the start of a new year, the euro can just turn around and start a major move up?
This would be 100% against conventional thinking, and would defy all we know about a very sick market.
After all, the US dollar, as the world's sole reserve currency, is being widely touted by the experts as a come-back kid for 2012 (recall it had no friends at the lows!), several eurozone countries appear on the brink of defaulting and leaving the eurozone, and Germany appears less than willing to provide more bail-out funds. It appears to be a no-brainer trade.
But all is not what it seems (a common theme in the markets!).
As a contrarian, I have to ask: Is all the bad news already in the price?
After all, since November alone, the EUR/USD has fallen from $1.42 to the recent low of $1.2850 a huge drop in two months.
This decline has been accompanied by the lopsided futures market holdings as revealed in the COT data.
Can there be any more euro bears out there without positions who are needed to force the market lower?
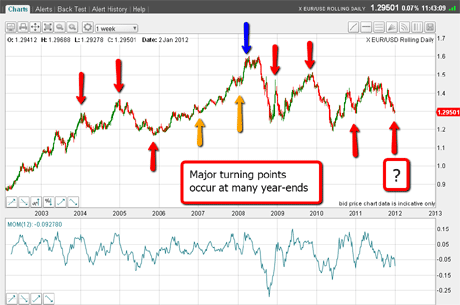
Above, I asked the question: Is the euro turning around here? As a matter of fact, there is considerable precedence for major turns at year-end. Here is a revealing chart it is the weekly chart going back to 2002:

(Click on the chart for a larger version)
The red arrows mark major turning points at year-end in 2003, 2004, 2005, 2008, 2009 and 2010. In 2007, there was a continuation (yellow arrow), and in 2008, there was another continuation (yellow arrow) with the market making a major top a few months later (blue arrow).
It's uncanny, is it not? So, based upon just this observation, the odds definitely point to a probable turn here.
Putting all the evidence together I have outlined, I shall be looking for the current rally to extend.
If my tramlines can be breached, my first target is the 1.32 area, the Fibonacci 23% retrace of the big decline off the late October high at 1.42.
With a following wind, I can see the 50% level being achievable to the 1.36 area, where it would almost certainly meet stiff resistance and might be a great place for me to take profits!
So 2012 appears to be starting off where we left last year with most traders being fooled by the zigs and the zags - and being blind-sided. I hope this doesn't happen to you!
If you're a new reader, or need a reminder about some of the methods I refer to in my trades, then do have a look at my introductory videos:
The essentials of tramline trading
An introduction to Elliott wave theory
Advanced trading with Elliott waves
Don't miss my next trading insight. To receive all my spread betting blog posts by email, as soon as I've written them, just sign up here .
Get the latest financial news, insights and expert analysis from our award-winning MoneyWeek team, to help you understand what really matters when it comes to your finances.
John is is a British-born lapsed PhD physicist, who previously worked for Nasa on the Mars exploration team. He is a former commodity trading advisor with the US Commodities Futures Trading Commission, and worked in a boutique futures house in California in the 1980s.
He was a partner in one of the first futures newsletter advisory services, based in Washington DC, specialising in pork bellies and currencies. John is primarily a chart-reading trader, having cut his trading teeth in the days before PCs.
As well as his work in the financial world, he has launched, run and sold several 'real' businesses producing 'real' products.
-
 Barings Emerging Europe trust bounces back from Russia woes
Barings Emerging Europe trust has added the Middle East and Africa to its mandate, delivering a strong recovery, says Max King
-
 How a dovish Federal Reserve could affect you
Trump’s pick for the US Federal Reserve is not so much of a yes-man as his rival, but interest rates will still come down quickly, says Cris Sholto Heaton