The most important chart of the year so far
Loss-making short-term trades are inevitable when searching for the start of new trends. John C Burford explains why knowing how to handle your losing trades is crucial to becoming a successful trader.
Get the latest financial news, insights and expert analysis from our award-winning MoneyWeek team, to help you understand what really matters when it comes to your finances.
You are now subscribed
Your newsletter sign-up was successful
Want to add more newsletters?

Twice daily
MoneyWeek
Get the latest financial news, insights and expert analysis from our award-winning MoneyWeek team, to help you understand what really matters when it comes to your finances.

Four times a week
Look After My Bills
Sign up to our free money-saving newsletter, filled with the latest news and expert advice to help you find the best tips and deals for managing your bills. Start saving today!
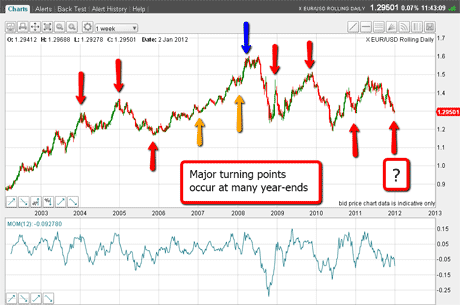
In the two articles I have written on the euro since the New Year: The ultimate contrarian trade to kick off 2012 and Is the euro set for a big comeback? I have made a case for a significant low in the EUR/USD to appear soon.
The very strong piece of evidence for my assertion is the 12-month cycle that I showed in both articles.
This may be the most important chart to have on your wall this month.
MoneyWeek
Subscribe to MoneyWeek today and get your first six magazine issues absolutely FREE

Sign up to Money Morning
Don't miss the latest investment and personal finances news, market analysis, plus money-saving tips with our free twice-daily newsletter
Don't miss the latest investment and personal finances news, market analysis, plus money-saving tips with our free twice-daily newsletter
Here it is again:

(Click on the chart for a larger version)
Of course, the market remains in a big downtrend, and especially from the 1.42 high on 27 October, the downtrend has been relentless. And it is not difficult to understand why.
The barrage of bad' news from the eurozone appears on front pages everywhere and is even the subject for erudite discussion in pubs!
But as was said in 1929, when even the shoe-shine boy has an opinion, it is time to look the other way.
My long trade ends with a loss
In my last post, I had a long trade, which was aborted as the market failed to hold the rally to 1.2880 level and dropped below the centre tramline.
This brings up an interesting point, which I will discuss, as it relates to how to handle a loss.
My long position at the 1.2820 area was protected by a sell-stop at the 1.2680 level, which was within my 3% rule limit.
I chose that level because it was well below the centre tramline. Any move back down to this area was a sign the downtrend had not completed.
But it was still a good trade, as I obeyed all of my trading rules!
Trader tip: When attempting to find the bottom (or top), of a strong trend I rarely find it on the first attempt. That means I take a loss (or several) before latching onto the new trend, if it is to occur.
Being able to handle losses calmly is a top requirement for successful trading. After a loss, re-examine your charts to see if your reasons for the trade still stack up. If they do, then keep looking for another entry.
All right, this trade was unsuccessful, so shall I just admit the euro is heading lower, as most people believe?
Recall that in the 4 January post, I showed the COT (Commitments of Traders) data which demonstrated the EUR/USD is a hugely crowded trade with speculators overwhelmingly bearish.
That means that short-covering rallies should be very large.
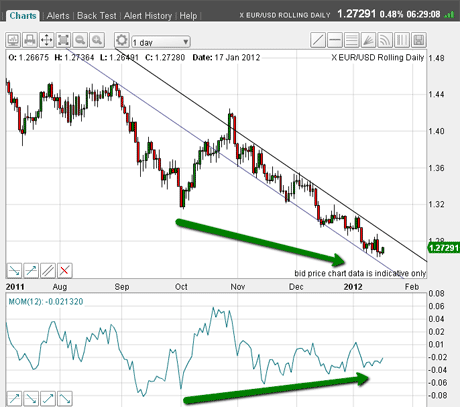
Here is the daily chart:

(Click on the chart for a larger version)
The downtrend is still being contained within my tramline pair, so the downtrend is intact.
But look at the momentum it has been losing downside strength (marked by green arrows) and there is a possible positive momentum divergence with the 4 October low.
This could be very significant.
Is the euro turning around?
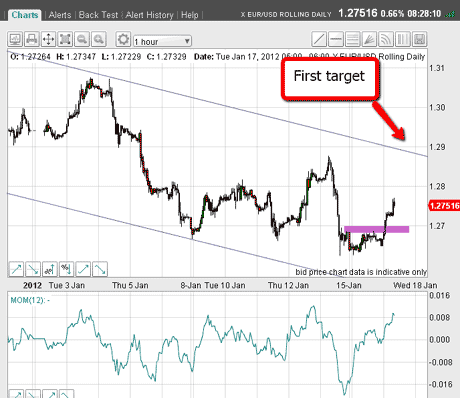
Now let's take a look at the shorter-term hourly chart:

(Click on the chart for a larger version)
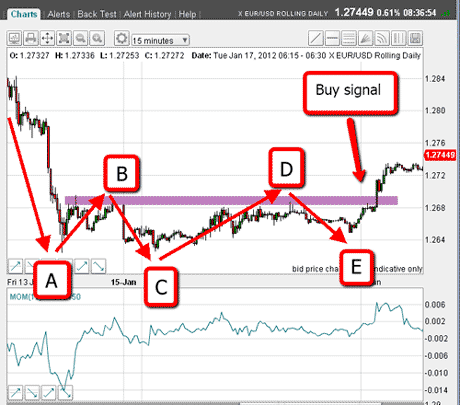
Yesterday on a US public holiday, please note the market traced out a five-wave pattern that I have noticed is very common at turning points:

(Click on the chart for a larger version)
The E wave did not make a new low, which would have signaled a continuation to new lows. Instead it stopped short of the A and C waves, and then rallied overnight to break above the line joining waves B and D.
Entry buy-stops could have been placed above the purple bar area.
This gives me high confidence in my reversal theory. But of course, protective stops still need to be employed just in case just below the E wave would be a good position.
This puts high confidence on my reversal theory, but of course, I will still have needed to employ protective stops, just in case at just below the E wave would have been good.
So, if there is a reversal here, ideally I need to see a quick rally perhaps to the upper tramline in the 1.2850 1.2900 area. Then a slight pull-back, and then a push up through this tramline.
That action would trace out an up-sloping five-wave Elliott pattern a sure indication that the trend had changed to up.
I will follow progress on a 30-min chart and see if a clear five-wave pattern emerges that satisfies the Elliott wave rules and guidelines.
Let's see how this pans out.
If you're a new reader, or need a reminder about some of the methods I refer to in my trades, then do have a look at my introductory videos:
The essentials of tramline trading
An introduction to Elliott wave theory
Advanced trading with Elliott waves
Don't miss my next trading insight. To receive all my spread betting blog posts by email, as soon as I've written them, just sign up here .
Get the latest financial news, insights and expert analysis from our award-winning MoneyWeek team, to help you understand what really matters when it comes to your finances.
John is is a British-born lapsed PhD physicist, who previously worked for Nasa on the Mars exploration team. He is a former commodity trading advisor with the US Commodities Futures Trading Commission, and worked in a boutique futures house in California in the 1980s.
He was a partner in one of the first futures newsletter advisory services, based in Washington DC, specialising in pork bellies and currencies. John is primarily a chart-reading trader, having cut his trading teeth in the days before PCs.
As well as his work in the financial world, he has launched, run and sold several 'real' businesses producing 'real' products.
-
 Can mining stocks deliver golden gains?
With gold and silver prices having outperformed the stock markets last year, mining stocks can be an effective, if volatile, means of gaining exposure
-
 8 ways the ‘sandwich generation’ can protect wealth
People squeezed between caring for ageing parents and adult children or younger grandchildren – known as the ‘sandwich generation’ – are at risk of neglecting their own financial planning. Here’s how to protect yourself and your loved ones’ wealth.