Is the euro set for a big comeback?
Trends can simply run on and on in foreign exchange markets. And that catches out many less experienced traders, says John C Burford. But is the euro finally due a turn?
Get the latest financial news, insights and expert analysis from our award-winning MoneyWeek team, to help you understand what really matters when it comes to your finances.
You are now subscribed
Your newsletter sign-up was successful
Want to add more newsletters?

Twice daily
MoneyWeek
Get the latest financial news, insights and expert analysis from our award-winning MoneyWeek team, to help you understand what really matters when it comes to your finances.

Four times a week
Look After My Bills
Sign up to our free money-saving newsletter, filled with the latest news and expert advice to help you find the best tips and deals for managing your bills. Start saving today!
In my last post on the EUR/USD of 4 January, I laid out a case for a potential counter-trend rally starting around year-end.
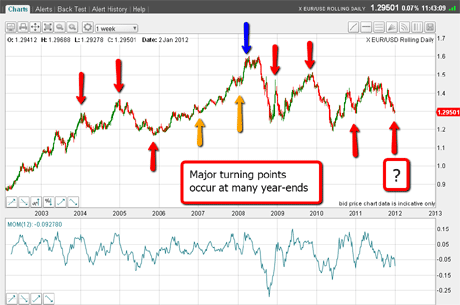
I posted the daily chart going back ten years, which showed a strong tendency for this market to make major turns around the New Year. I've repeated it below.
(Click on the chart for a larger version)
MoneyWeek
Subscribe to MoneyWeek today and get your first six magazine issues absolutely FREE

Sign up to Money Morning
Don't miss the latest investment and personal finances news, market analysis, plus money-saving tips with our free twice-daily newsletter
Don't miss the latest investment and personal finances news, market analysis, plus money-saving tips with our free twice-daily newsletter
There is a strong 12-month cycle at play here, as you can see.
Could history be repeating itself now?
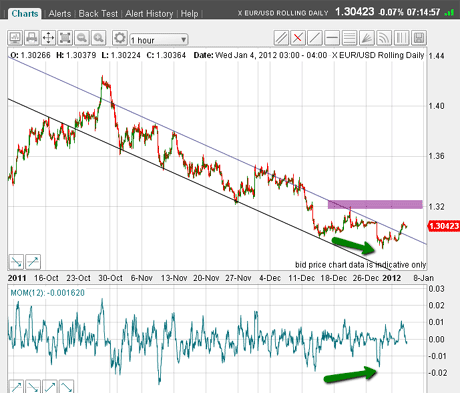
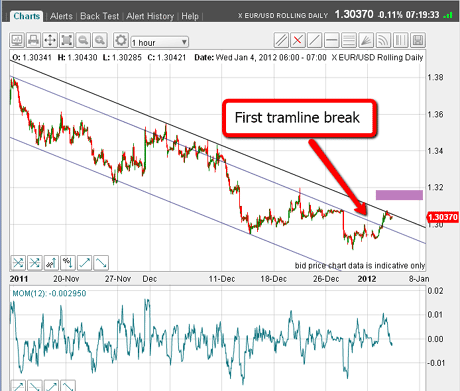
In that post, I also showed charts (see below) where I had possible buy-stops (marked by the purple bars)placed to catch a potential rally.
(Click on the chart for a larger version)
(Click on the chart for a larger version)
Since then, the markets sold off some more and the buy-stoporders were not touched, so no harm done.
Trader tip: placing entry orders using stops is an excellent technique when attempting to catch a trend reversal. But one drawback is that protective stop placement becomes difficult. I may produce a video on this topic of protective stop placements at a later date.
This action illustrates vividly the character of foreign exchange markets the tendency for trends to carry on, and on, and on!
You can see this in many long-term charts, and that is why there are many experienced traders who trade the momentum in the expectation that trends will generally continue.
Many inexperienced traders try bottom-fishing on a hope, then get their heads handed to them as the market just carries on.
But with the powerful 12-month cycle at work, are we about to see a turn?
Trying to find the turning point for the euro
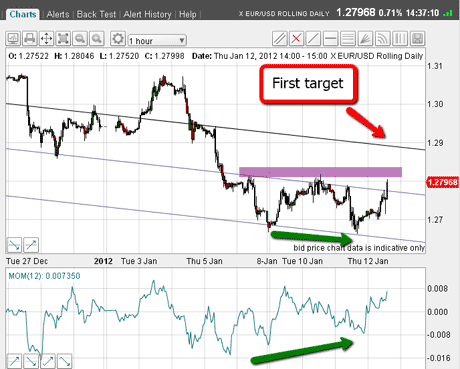
On Wednesday, with the market having challenged the 1.2680 level, I believed if a turn was about to occur, I would need to see a rally to an important tramline.
So, I went searching for reliable tramlines, and found this on the hourly chart yesterday:
(Click on the chart for a larger version)
I first drew the centre tramline (best fit), and proceeded to connect the two low points for the lowest tramline. The upper tramline then drew itself (at the same distance above the central line, as the bottom tramline was below it).
Then we had an upward break. I was very pleased to see the potential positive momentum divergence at Wednesday's low, as that gave me the courage to place buy-stop entry orders in the region of the purple bar.
An amazing set of tramlines
I tend to get excited by the possibility of getting on board a potential major move early, especially when it is counter-mainstream.
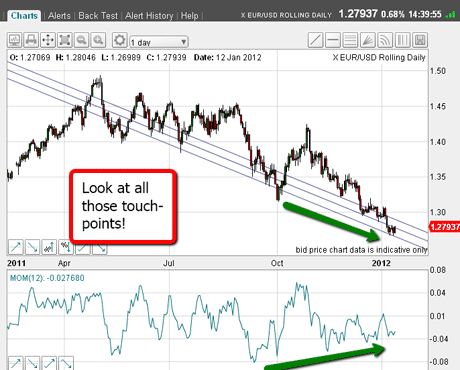
I have drawn tramlines on a very short-term chart (see below). To cement its validity, I need to ensure that there are more touch-points from previous trading. This is the amazing result:
(Click on the chart for a larger version)
If you look closely, you will find a multitude of excellent touch-points going back to last April, despite the complexity of the chart!
I believe these tramlines will continue to act as lines of support and resistance.
As I write on Friday morning, the market has moved up and my buy orders are filled.
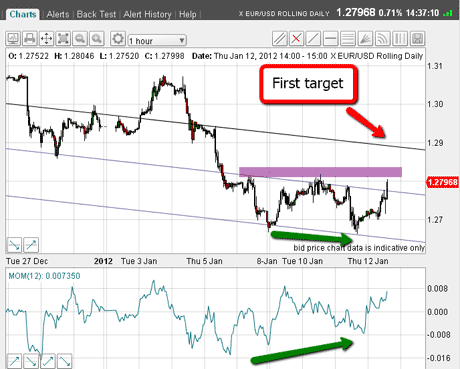
And this morning, the market has indeed rallied to my first target in the 1.2880 area (see the earlier chart, which I've repeated below), and is currently backing off as it hits resistance.
(Click on the chart for a larger version)
OK, the market has reached first base is there a home run on the cards?
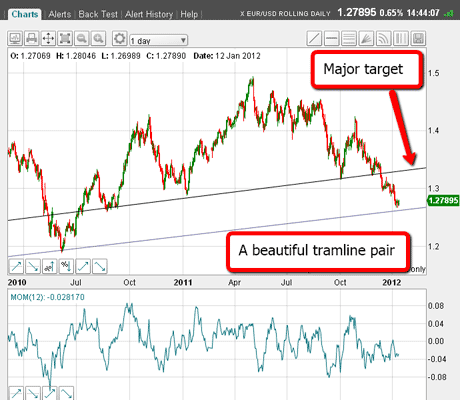
Now is the time to look at the bigger picture on the daily chart:
(Click on the chart for a larger version)
I have shown the upper tramline in previous emails, and it remains valid.
But now, with the recent 1.27 low in place, my lower tramline confirms its placement, as the lower tramline takes in the significant 1.20 low and touches the recent 1.27 low. How pretty!
At the summer 2010 1.20 low, the market made a scalded cat bounce up away.
Will we see a similar action this time? After all, the market apparently does not like trading between these tramlines it has not spent much time there.
If this plays out, my upper target will be the underside of the upper tramline in the 1.32 1.34 zone. Now that's what I would consider a home run for the bulls!
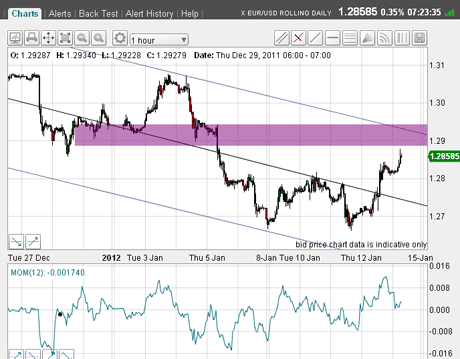
To wrap up, let's have a look at the current short-term chart:
(Click on the chart for a larger version)
I have drawn the new set of tramlines, and the purple bar represents solid chart resistance exactly at the 1.2880 area, which is where the previous tramline position occurs!
I would expect some pause in the rally here, but with the short-euro trade being so crowded as I explained last time more short-covering would set this market alight.
But first, the market may try to drop back to the centre tramline, where the rally would be tested.
There is an option for me to then place low-risk trades, since a significant drop below the centre tramline would likely doom the rally attempt, at least for now.
If you're a new reader, or need a reminder about some of the methods I refer to in my trades, then do have a look at my introductory videos:
The essentials of tramline trading
An introduction to Elliott wave theory
Advanced trading with Elliott waves
Don't miss my next trading insight. To receive all my spread betting blog posts by email, as soon as I've written them, just sign up here .
Get the latest financial news, insights and expert analysis from our award-winning MoneyWeek team, to help you understand what really matters when it comes to your finances.
John is is a British-born lapsed PhD physicist, who previously worked for Nasa on the Mars exploration team. He is a former commodity trading advisor with the US Commodities Futures Trading Commission, and worked in a boutique futures house in California in the 1980s.
He was a partner in one of the first futures newsletter advisory services, based in Washington DC, specialising in pork bellies and currencies. John is primarily a chart-reading trader, having cut his trading teeth in the days before PCs.
As well as his work in the financial world, he has launched, run and sold several 'real' businesses producing 'real' products.
-
 Average UK house price reaches £300,000 for first time, Halifax says
While the average house price has topped £300k, regional disparities still remain, Halifax finds.
-
 Barings Emerging Europe trust bounces back from Russia woes
Barings Emerging Europe trust has added the Middle East and Africa to its mandate, delivering a strong recovery, says Max King