The Dow keeps confounding the bears
The rally in the Dow has defied expectations by rising ever higher. But now the charts are signalling a change, says John C Burford - and it could be dramatic.
Get the latest financial news, insights and expert analysis from our award-winning MoneyWeek team, to help you understand what really matters when it comes to your finances.
You are now subscribed
Your newsletter sign-up was successful
Want to add more newsletters?

Twice daily
MoneyWeek
Get the latest financial news, insights and expert analysis from our award-winning MoneyWeek team, to help you understand what really matters when it comes to your finances.

Four times a week
Look After My Bills
Sign up to our free money-saving newsletter, filled with the latest news and expert advice to help you find the best tips and deals for managing your bills. Start saving today!
I will continue from Friday's Dow coverage, as it is a classic example of how you need to combine strategy with tactics to succeed in trading. That applies to all forms of investing and trading over all time frames.
As all traders know, timing is critical for success. We can be correct in our strategy, but if we get it wrong on tactics (timing), we can still lose money. It's an unforgiving game.
But the key to long-term success is how you react to set-backs and that depends to a large extent on your adherence to total discipline.
MoneyWeek
Subscribe to MoneyWeek today and get your first six magazine issues absolutely FREE

Sign up to Money Morning
Don't miss the latest investment and personal finances news, market analysis, plus money-saving tips with our free twice-daily newsletter
Don't miss the latest investment and personal finances news, market analysis, plus money-saving tips with our free twice-daily newsletter
If you make a trade based on your best analysis at the time, and still lose money, it is still a good trade! Put it down as a necessary business expense.
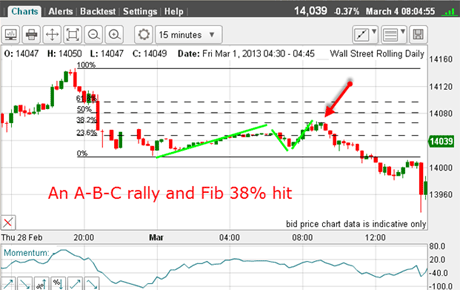
On Friday, I left my post with a suggested trade set-up, and this was it:

(Click on the chart for a larger version)
From Thursday's 14,147 high, the market declined in five minor waves, as I showed on Friday. I then expected an A-B-C counter-trend rally to a Fibonacci retrace level, and then a resumption of the decline in a larger third wave.
My trade was too short at the C wave high, and near the 38% Fibonacci level (red arrow) with an appropriate stop, of course.
This was my best guess at the time. Indeed, the trade did go my way, with the Dow falling sharply to 13,930 later on Friday. So far, so good both my strategy and tactics were working.
A lesson in Wave theory
But we all know that there is never certainty in the markets. With Elliott wave theory, there are always alternative scenarios that could play out with different levels of probability attached. This needs to be kept in mind when using Elliott waves.
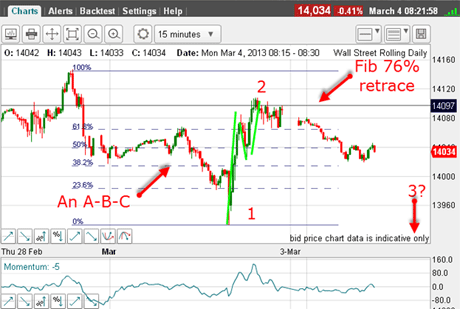
And so it proved here, because from Friday's 13,930 low, a vigorous rally ensued and the market rose above my short entry to stop me out:

(Click on the chart for a larger version)
So now it is clear that instead of being in a third wave down, the move off Thursday's 14,147 high was in three waves and note the positive-momentum divergence at the C wave (13,930) low. This was a clear danger signal for the bears.
And if you measure the A and C waves, you will discover that at the 13,930 low, there is equality between the A and C waves! How about that?
So, on two different scales, we have great examples of this equality rule.
Trader tip: When in a third wave, where this could either be wave C or wave 3 of a potential five-wave pattern, use the equality rule to measure where the C wave should end. If it truly is a C wave, the market should turn there. If the market ploughs through this level, you almost certainly have a third wave, indicating a likely extension of the move.
Right after the 13,930 low was in place, I applied my Fibonacci levels and sure enough, the rally was contained by the 76% level so far.
Now Friday's rally has a clear A-B-C form to it, indicating a move to a new high was unlikely, since A-B-C rallies are counter-trend.
This is yet another case of the stock market making deep upward retracements, as it has for several years now. From these retracements, the market has probed the downside, but has been met by support.
One day, this support will give way.
So what is my best guess for the market as I see it this morning?
Until proven otherwise, the market has completed its four-year ascent to my long-term target at 14,136 (see Friday's post). This means I am working with a new downtrend.
My best guess now is that from Thursday's high, the move down to Friday's 13,930 low is a larger wave 1, the rally on Friday is wave 2, and we should be in a third wave down.
If correct, I will expect to see rapid progress to the downside over the next few days. But if the market moves above my wave 2 high, I will need to re-assess.
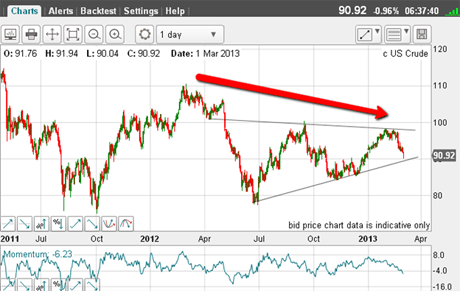
One piece of evidence that supports my long-term view of stocks is the behaviour of the crude oil market. For a long time, the stock market and crude have moved in rough parallel. When crude declines, stocks decline.
Here is the daily crude chart:

(Click on the chart for a larger version)
It is clear that crude made its high last March a year ago while the Dow continued its advance.
There is a massive divergence at work, and something has to give!
If you're a new reader, or need a reminder about some of the methods I refer to in my trades, then do have a look at my introductory videos:
The essentials of tramline trading
An introduction to Elliott wave theory
Advanced trading with Elliott waves
Don't miss my next trading insight. To receive all my spread betting blog posts by email, as soon as I've written them, just sign up here . If you have any queries regarding MoneyWeek Trader, please contact us here.
Get the latest financial news, insights and expert analysis from our award-winning MoneyWeek team, to help you understand what really matters when it comes to your finances.
John is is a British-born lapsed PhD physicist, who previously worked for Nasa on the Mars exploration team. He is a former commodity trading advisor with the US Commodities Futures Trading Commission, and worked in a boutique futures house in California in the 1980s.
He was a partner in one of the first futures newsletter advisory services, based in Washington DC, specialising in pork bellies and currencies. John is primarily a chart-reading trader, having cut his trading teeth in the days before PCs.
As well as his work in the financial world, he has launched, run and sold several 'real' businesses producing 'real' products.
-
 Should you buy an active ETF?
ETFs are often mischaracterised as passive products, but they can be a convenient way to add active management to your portfolio
-
 Power up your pension before 5 April – easy ways to save before the tax year end
With the end of the tax year looming, pension savers currently have a window to review and maximise what’s going into their retirement funds – we look at how