Here’s an ideal set up for a trade
The Dow's ceaseless rally has time again defied the bears. But now, the top of the market could be upon us. Using his chart trading methods, John C Burford explains the best way to trade it.
Get the latest financial news, insights and expert analysis from our award-winning MoneyWeek team, to help you understand what really matters when it comes to your finances.
You are now subscribed
Your newsletter sign-up was successful
Want to add more newsletters?

Twice daily
MoneyWeek
Get the latest financial news, insights and expert analysis from our award-winning MoneyWeek team, to help you understand what really matters when it comes to your finances.

Four times a week
Look After My Bills
Sign up to our free money-saving newsletter, filled with the latest news and expert advice to help you find the best tips and deals for managing your bills. Start saving today!
Recently, I've had many requests to resume coverage of the Dow. But with the stunning action in gold, I believed this market was best for illustrating the many principles I employ.
My primary aim in these posts is always to select a market that can teach traders how I use the methods I have honed over many years in this most difficult of arenas.
My intention is not to offer hot tips here you will have to go elsewhere if you want those. My hope is that the interested trader can use my methods and attitudes in finding profitable situations in his/her own markets.
MoneyWeek
Subscribe to MoneyWeek today and get your first six magazine issues absolutely FREE

Sign up to Money Morning
Don't miss the latest investment and personal finances news, market analysis, plus money-saving tips with our free twice-daily newsletter
Don't miss the latest investment and personal finances news, market analysis, plus money-saving tips with our free twice-daily newsletter
And the Dow and all other stock indexes has been particularly difficult to trade for me recently, as it has been refusing to make a top against my expectations and odds.
A big turn at hand for the Dow?
But today is a particularly opportune time to resume coverage as I believe the odds are stacking up that the big turn is at hand.
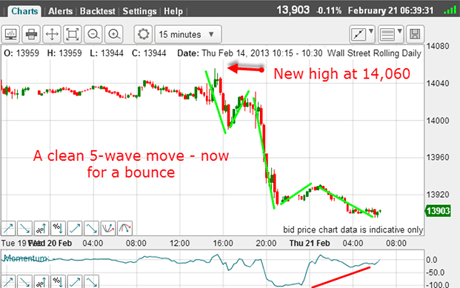
In my lastpost on 22 February, I noted the excellent five-wave move down off the then 14,060 high:
(Click on the chart for a larger version)
This is one of the major patterns that signal a top in Elliott wave theory. But as we all know, there is never 100% certainty in the markets.
All things are possible, but not all are probable.
But the bounce I was expecting was far stronger than I anticipated. I should have paid more attention to the massive positive-momentum divergence. In general, the bigger the divergence, the bigger the bounce.
I had a short trade working from the 14,020 area with my protective stop at break-even in the unlikely event that the market would rally back to that level.
Unlikely though it was, this is what the market decided to do! A little more irrational exuberance popped its ugly head up following the Fed chairman's testimony that he was committed to continuing the QE programme indefinitely.
Many have linked the rise in stocks since 2009 to the Fed's money-expanding operations against a backdrop of a not too vigorous economy, and so this reaction was logical from that perspective.
But changes are afoot and to me, it appears the political appetite for QE is diminishing. Naturally, the stock market will signal such a shift long before it becomes apparent to most.
And have we witnessed such a shift?
Be cautious of the overshoot
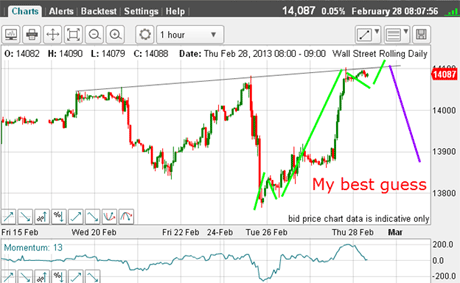
I follow not only the Dow, but the broader indexes, such as the S&P 500. A comparison of the two charts is instructive. Here is the Dow chart I took yesterday:
(Click on the chart for a larger version)
From Monday's low, the rally has that distinct potential five-wave pattern with only the fifth wave to a new high to complete it. Remember, fifth waves are ending waves.
Yesterday morning, the fourth wave was in progress.
Note that there is a very significant trendline joining the highs. This is a crucial piece of evidence for later use!
A poke above this line and a swift reversal off the fifth wave back below this line would produce a head fake a classic reversal signal. Some call this an overshoot. It takes out many shorts who placed stops above this line, but is met by heavy selling.
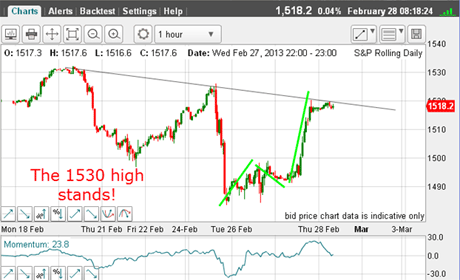
So what was the S&P looking like yesterday morning?
(Click on the chart for a larger version)
Here, the line joining the tops is slanting down, as opposed to the Dow line.
This means there is a large divergence a sure sign of a fractured stock market. While the Dow yesterday pushed to a new high, the broader S&P did not.
That is why I suspected a turn was at hand ideally within hours!
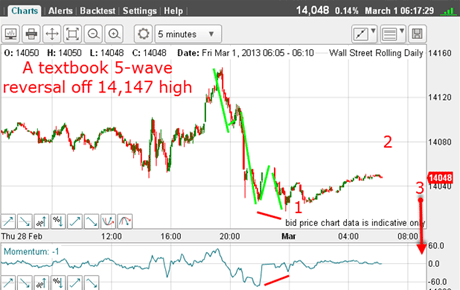
And sure enough, the Dow pushed to a high of 14,147 yesterday afternoon right after the release of some bullish' US economic data. That was the fifth wave I was looking for and a short trade was indicated.
This is the position this morning:
(Click on the chart for a larger version)
Take a look at yesterday's bull's eye
There is a clear five-wave move down on this five-minute chart, and a bounce taking place. Note the positive-momentum divergence at the low.
If the 14,147 high can hold, that should be wave 2, leading to a large wave 3 down. That is what I shall be looking for.
OK, but is there any method of analysis that can pinpoint the price level at which this major turn can be expected? Because if there is, that is one heck of a useful tool to have in your box!
The stock market rally started in 2009 with the Dow sinking to 6,440. Happy days!
The nominal market peaked in 2007 at 14,226, and I have been assuming since then, the market is in a bear market rally, and I have placed Elliott wave labels on the waves within this rally in previous posts.
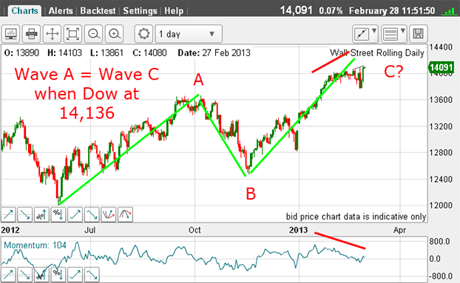
The important period is the rally from last summer's low, which I estimate is an A-B-C. This would fit the counter-trend theory.
One of the most common relationships in A-B-C patterns is equality of waves A and C. This is a Fibonacci relationship, of course.
I should mention that another common relationship is for wave C to be a Fibonacci 1.612 times wave A. That would target the Dow at 15,156 a rather fanciful objective, I believe.
If you measure the height of the A wave from the low to the top, and then measure the height of the C wave from the B wave low to the top, then the equality target becomes 14,136.
Yesterday's high was 14,147 only 11 pips away!
To me, that is a bull's eye. Here is the chart I took yesterday in anticipation of the high:
(Click on the chart for a larger version)
To complete the bearish picture, there is a stark negative-momentum divergence building at the C wave high.
So the odds are stacking up for the top to be within reach, if not already attained.
How will I be trading it? Until otherwise proven from the short side, but on rallies.
The stock market has exhibited many deep upward retracements in recent years and trading breakouts is not the way to go and this is where Fibonacci comes into its own.
Place your Fibonacci levels on yesterday's decline and find the levels that should signal the turns. The most common levels are the 38%, 50% and 62%. That could be the place for an entry, but using the 3% rule for protection, of course.
The ideal scenario is to spot an A-B-C pattern and get onboard on the C wave when it moves above the A wave high.
As I gaze at the 15-minute chart, I can see such a potential C wave. This is an ideal set-up for a trade.
Do you see the trade? I hope you do. A trade like this, with tricky five-wave patterns and Fibonacci, can be difficult to get across inpost format. These trades are a bit more subtle but you need to master them to make a good income from trading.
If you're a new reader, or need a reminder about some of the methods I refer to in my trades, then do have a look at my introductory videos:
The essentials of tramline trading
An introduction to Elliott wave theory
Advanced trading with Elliott waves
Don't miss my next trading insight. To receive all my spread betting blog posts by email, as soon as I've written them, just sign up here . If you have any queries regarding MoneyWeek Trader, please contact us here.
Get the latest financial news, insights and expert analysis from our award-winning MoneyWeek team, to help you understand what really matters when it comes to your finances.
John is is a British-born lapsed PhD physicist, who previously worked for Nasa on the Mars exploration team. He is a former commodity trading advisor with the US Commodities Futures Trading Commission, and worked in a boutique futures house in California in the 1980s.
He was a partner in one of the first futures newsletter advisory services, based in Washington DC, specialising in pork bellies and currencies. John is primarily a chart-reading trader, having cut his trading teeth in the days before PCs.
As well as his work in the financial world, he has launched, run and sold several 'real' businesses producing 'real' products.
-
 Average UK house price reaches £300,000 for first time, Halifax says
While the average house price has topped £300k, regional disparities still remain, Halifax finds.
-
 Barings Emerging Europe trust bounces back from Russia woes
Barings Emerging Europe trust has added the Middle East and Africa to its mandate, delivering a strong recovery, says Max King