The Dow Jones is at a critical level
Trading is all about adaptability, and traders must be prepared to abandon their plans to stay out of grief. With his most recent trade blown out of the water, John C Burford hunts for a second.
Get the latest financial news, insights and expert analysis from our award-winning MoneyWeek team, to help you understand what really matters when it comes to your finances.
You are now subscribed
Your newsletter sign-up was successful
Want to add more newsletters?

Twice daily
MoneyWeek
Get the latest financial news, insights and expert analysis from our award-winning MoneyWeek team, to help you understand what really matters when it comes to your finances.

Four times a week
Look After My Bills
Sign up to our free money-saving newsletter, filled with the latest news and expert advice to help you find the best tips and deals for managing your bills. Start saving today!
Just to prove once again that markets are full of surprises, the suggested Elliott wave count in my lastpost was well and truly blown out of the water.
Just after I had finished writing on Friday afternoon, the market caught a bid and zoomed up, thereby destroying my wonderful third wave' interpretation!
The vigour of the rally meant that we certainly were not in a strong third wave down. That much was obvious.
MoneyWeek
Subscribe to MoneyWeek today and get your first six magazine issues absolutely FREE

Sign up to Money Morning
Don't miss the latest investment and personal finances news, market analysis, plus money-saving tips with our free twice-daily newsletter
Don't miss the latest investment and personal finances news, market analysis, plus money-saving tips with our free twice-daily newsletter
If we were, the market would be continuing to make big leaps downwards, as we were Friday afternoon.
But this is a vivid illustration of one of the most useful facets of Elliott waves.
Trading tip: If you suspect you are in a third Elliott wave, the market should be making big moves in short time in your direction. If the market suddenly turns around, that may well be a sign you are wrong. Personally, I abandon the trade if this occurs.
Remember always be on your toes
If the market is not going in your direction according to your Elliott wave count, there's probably something else going on.
On these occasions, I like to stand back and observe the market for a while. Very often, a new pattern emerges which I can trade off. And so it happened here.
On Monday, it was clear that the move down from the 11,400 area on Thursday was a three-wave affair.
Remember, being on your toes and ready to abandon your plan if conditions change will keep you out of a lot of grief.
OK, I had shorted the Dow at the 11,350 level last Thursday after it spiked to the Fibonacci 38% level. I covered the trade at the 11,200 level on Friday on the big rally.
Since then, the market has rallied further to above the previous high at 11,500 made on 17 August.
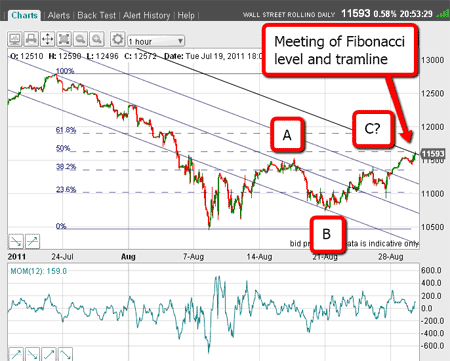
This makes the pattern of the relief rally off the 10,450 low a potential A-B-C, which is larger than I had first thought.

(Click on the chart for a larger version)
I have marked this A-B-C pattern on the chart.
We know that in a bear market, most corrective patterns have an upward three-wave structure.
That is why I like to wait until I can see a clear C wave (which must lie above or level with the A wave), and then look to make another short trade.
With yesterday's rally to the 11,600 area, I have a candidate!
Hunting for a new short trade
But first keep in mind the larger picture I have identified the large wave 3 down to the 10,450 level and we are currently in the wave 4 up, prior to another leg down in wave 5.
This is what I currently expect.
On the above chart, I have drawn four tramlines, all derived from my initial tramline drawn off the July 12,800 high. None of them are perfect (very few are in real life), but I have enough touch points to give me hope.
Yesterday's rally to the 11,600 level takes it up right to the Fibonacci 50% retrace of the entire move down from the 12,800 to the 10,450 levels.
That's a nice hit. And that alone would cause me to set a sell order at 11,600.
But that's not all it is also where the down-sloping tramline occurs. A double whammy!
The market would need to have a lot in its tank to get past there.
But the evidence does not end there. We have a potential negative momentum divergence at the 11,600 level on the hourly chart. A triple whammy!
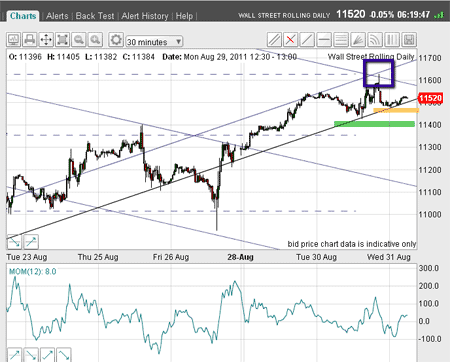
Here is a close-up chart:

(Click on the chart for a larger version)
Last night just before the close, the market spiked up to just above 11,600 and then spiked back down.
This behaviour is typical when the market hits strong resistance, as I expected here.
An opportunity opens up
OK, we have another small-scale pattern that cries out for tramlines! These are the up-sloping pair and it has many very good touch-points.
If the market is turning down now, it should break below the lower up-sloping tramline very soon.
Confirmation would come if the market broke the support at the yellow bar. Even better confirmation lies at the green bar.
Depending on your risk tolerance, a trader would set sell orders just below one of the bars, using the 11,600 area as your protective stop (lying just above the tramline).
The response to my first video tutorial on tramline trading has been very gratifying sincere thanks to all wholeft your comments. It appears these concepts, while new to many, are being taken up with great results.
We shall beposting another tutorial video very soon.
Don't miss my next trading insight. To receive all my spread betting blog posts by email, as soon as I've written them, just sign up here .
Get the latest financial news, insights and expert analysis from our award-winning MoneyWeek team, to help you understand what really matters when it comes to your finances.
John is is a British-born lapsed PhD physicist, who previously worked for Nasa on the Mars exploration team. He is a former commodity trading advisor with the US Commodities Futures Trading Commission, and worked in a boutique futures house in California in the 1980s.
He was a partner in one of the first futures newsletter advisory services, based in Washington DC, specialising in pork bellies and currencies. John is primarily a chart-reading trader, having cut his trading teeth in the days before PCs.
As well as his work in the financial world, he has launched, run and sold several 'real' businesses producing 'real' products.
-
 MoneyWeek Talks: The funds to choose in 2026
Podcast Fidelity's Tom Stevenson reveals his top three funds for 2026 for your ISA or self-invested personal pension
-
 Three companies with deep economic moats to buy now
Opinion An economic moat can underpin a company's future returns. Here, Imran Sattar, portfolio manager at Edinburgh Investment Trust, selects three stocks to buy now