Hunting for trades in the Dow
By looking at the action around tramlines, Fibonacci levels and Elliot waves, John C Burford finds a great entry point for a short trade on the Dow.
Get the latest financial news, insights and expert analysis from our award-winning MoneyWeek team, to help you understand what really matters when it comes to your finances.
You are now subscribed
Your newsletter sign-up was successful
Want to add more newsletters?

Twice daily
MoneyWeek
Get the latest financial news, insights and expert analysis from our award-winning MoneyWeek team, to help you understand what really matters when it comes to your finances.

Four times a week
Look After My Bills
Sign up to our free money-saving newsletter, filled with the latest news and expert advice to help you find the best tips and deals for managing your bills. Start saving today!
I hope you have watched my video tutorial on the introduction to tramline trading. If you missed it, watch it here.
When I left the Dow on 22 August, I was looking for an A-B-C rally pattern to correct the massive 2,300 point plunge that had just occurred, where the low was 10,450 on 9 August.
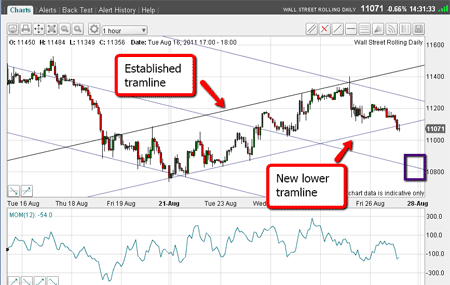
Here is the chart as of Friday afternoon:
MoneyWeek
Subscribe to MoneyWeek today and get your first six magazine issues absolutely FREE

Sign up to Money Morning
Don't miss the latest investment and personal finances news, market analysis, plus money-saving tips with our free twice-daily newsletter
Don't miss the latest investment and personal finances news, market analysis, plus money-saving tips with our free twice-daily newsletter

(Click on the chart for a larger version)
I have re-drawn the down-sloping tramlines very slightly to align them better with the various touch-points.
But recent action has allowed me to draw a new tramline pair the down-sloping ones.
Since I was looking for another spot to place a low-risk short trade, I was handed one on a plate right at the intersection of the up-sloping and the down-sloping tramlines.
Note, I had drawn the up-sloping tramlines beforehand, as I had sufficient touch-points.
Note the spike' at this intersection just what you would expect if this was to be major resistance.
Trading tip: When two tramlines intersect, that is usually a very powerful reversal point and a great place to place entry or exit orders.
Observe the action surrounding tramlines and Fibonacci levels. If you see a spike (a sudden lurch and then an equally sudden retreat), that is likely a clue that you have found a turning-point! They are easy to spot using candlestick' charts, as they appear as tails in the char below.
My first downside target is marked by the purple box.
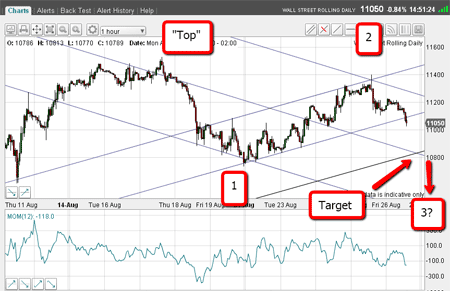
Now, an important question: how are the Elliott waves?
Here is the hourly chart showing a budding third wave down:

(Click on the chart for a larger version)
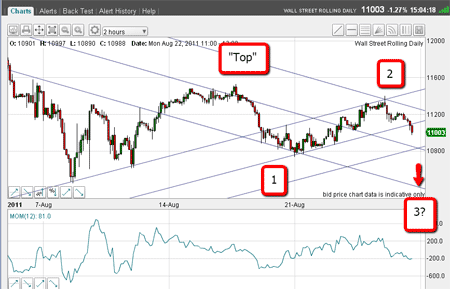
But this pattern lies within a larger pattern. Here is the two-hour chart:

(Click on the chart for a larger version)
Can you see the potential third Elliott wave?
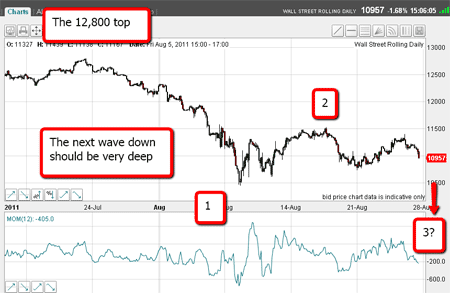
And here is an even larger scale chart:

(Click on the chart for a larger version)
It shows the potential larger-scale third Elliott wave.
So, I can count three separate potential third Elliott waves of differing scale.
If this plays out as I expect, the current move will be very, very deep, because three co-incident third waves is a rare beast, and they are always relentless in their scope.
If I am correct, the 10,450 low made on 9 August is within reach.
Don't miss my next trading insight. To receive all my spread betting blog posts by email, as soon as I've written them, just sign up here .
Get the latest financial news, insights and expert analysis from our award-winning MoneyWeek team, to help you understand what really matters when it comes to your finances.
John is is a British-born lapsed PhD physicist, who previously worked for Nasa on the Mars exploration team. He is a former commodity trading advisor with the US Commodities Futures Trading Commission, and worked in a boutique futures house in California in the 1980s.
He was a partner in one of the first futures newsletter advisory services, based in Washington DC, specialising in pork bellies and currencies. John is primarily a chart-reading trader, having cut his trading teeth in the days before PCs.
As well as his work in the financial world, he has launched, run and sold several 'real' businesses producing 'real' products.
-
 Average UK house price reaches £300,000 for first time, Halifax says
While the average house price has topped £300k, regional disparities still remain, Halifax finds.
-
 Barings Emerging Europe trust bounces back from Russia woes
Barings Emerging Europe trust has added the Middle East and Africa to its mandate, delivering a strong recovery, says Max King