The Dow hits my target
Many traders are expecting a rally in the Dow. But with bearish sentiment in the air, will the market disappoint? John C Burford examines the charts.
Get the latest financial news, insights and expert analysis from our award-winning MoneyWeek team, to help you understand what really matters when it comes to your finances.
You are now subscribed
Your newsletter sign-up was successful
Want to add more newsletters?

Twice daily
MoneyWeek
Get the latest financial news, insights and expert analysis from our award-winning MoneyWeek team, to help you understand what really matters when it comes to your finances.

Four times a week
Look After My Bills
Sign up to our free money-saving newsletter, filled with the latest news and expert advice to help you find the best tips and deals for managing your bills. Start saving today!
Before I talk about the Dow, I want to follow up on my coverage of Apple shares, since this is a classic example of my tramline methods.
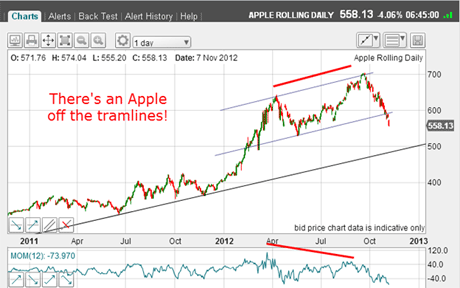
Recall on 9 November, Apple was falling precipitously from its $700 high and had broken a major tramline:

(Click on the chart for a larger version)
MoneyWeek
Subscribe to MoneyWeek today and get your first six magazine issues absolutely FREE

Sign up to Money Morning
Don't miss the latest investment and personal finances news, market analysis, plus money-saving tips with our free twice-daily newsletter
Don't miss the latest investment and personal finances news, market analysis, plus money-saving tips with our free twice-daily newsletter
Because I had a very strong tramline below it which was drawn parallel to the top tramline connecting the two major peaks I could set a major target on that lowest line in the $500 area. According to my tramline rules, this is the spot to take profits on shorts and then reverse positions and go long.
Why go long? Because the major trend is still up and it is usually best to trade with the major trend (unless you spot a great short!).
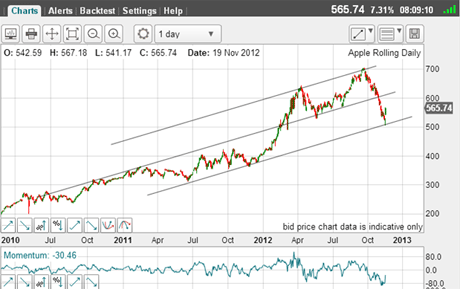
And this was the picture yesterday:

(Click on the chart for a larger version)
The market duly collapsed to my tramline on Friday to the $505 low, and on Monday, it bounced off it like a scalded cat.What a perfect hit and then the bonus of a 13% rally in two days!
That is the power of my tramline methods in a nutshell.
And where is my next target?At the underside of the centre tramline, of course.
How many traders took advantage of this opportunity to make money on the downside, and establish a great long position?
I would say very few, despite Apple being one of the most watched and traded shares on Nasdaq.
Now, why is this?
The 'woulda, coulda, shoulda' syndrome
Over the years, I have observed the 'woulda, coulda, shoulda' syndrome in traders.You know how this works:
"I woulda done it if the dog hadn't chewed my computer cable."
"I coulda done it if I wasn't tied up taking the kids to school."
"Darn it, I shoulda done it because it was a fabulous trade, and I missed it.But I'll definitely do it next time."
Of course, the next time is always a distant dream.
Traders who have this infirmity will always miss the boat and probably are not cut out for trading anyway.
Serious trading requires utmost concentration and a decisiveness to act when your method so indicates. Sometimes, waiting a day or even an hour depending on your time frame means missing the boat.
If you will be away from your screen for long periods, then you need to set resting orders which are triggered if the market reaches your price.The Apple example is a case in point.
But if you miss a trade, you miss a trade.Move on to search out the next one there will always be a next one, rest assured.
The Dow bounces off my target
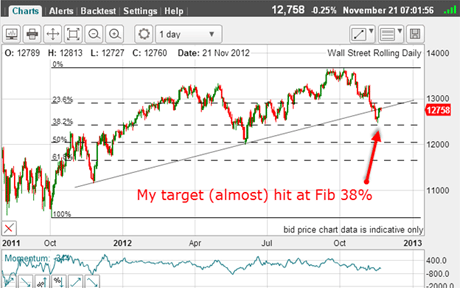
In Friday'spost, the Dow had reached one of my major tramline targets, where short-term traders would have been taking at least partial profits.
And on Monday the market bounced off this tramline and staged a sharp rally out of the highly oversold condition, as I posited.
Bear-market rallies in the Dow have lately been very sharp with deep upward retracements. We may well get another one here.That's something to keep in mind.
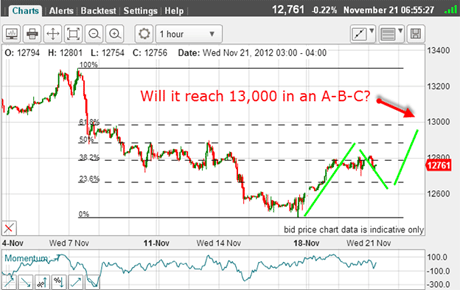
Here is the position this morning:

(Click on the chart for a larger version)
In my Friday post, I had a first target at the Fibonacci 38% level. Later that day, the market came within a whisker of it nice!
This week, the market has rallied right back to the underside of my tramline.If it turns back here, I will have my next target in my sights at the 50% level around the 4 June low level at 12,000.
But here's another possibility:

(Click on the chart for a larger version)
So far, the rally does not have an A-B-C look, and the ideal scenario is for one before heading back down (preferably with a negative momentum divergence). I have drawn in this possible scenario with the green bars (not necessarily to scale).
Many are waiting for the 'Santa rally' into December, but with sentiment remaining bullish among the large specs, the odds for this appear unlikely unless we do see that rally back to the 13,000 area.
If you're a new reader, or need a reminder about some of the methods I refer to in my trades, then do have a look at my introductory videos:
The essentials of tramline trading
An introduction to Elliott wave theory
Advanced trading with Elliott waves
Don't miss my next trading insight. To receive all my spread betting blog posts by email, as soon as I've written them, just sign up here . If you have any queries regarding MoneyWeek Trader, please contact us here.
Get the latest financial news, insights and expert analysis from our award-winning MoneyWeek team, to help you understand what really matters when it comes to your finances.
John is is a British-born lapsed PhD physicist, who previously worked for Nasa on the Mars exploration team. He is a former commodity trading advisor with the US Commodities Futures Trading Commission, and worked in a boutique futures house in California in the 1980s.
He was a partner in one of the first futures newsletter advisory services, based in Washington DC, specialising in pork bellies and currencies. John is primarily a chart-reading trader, having cut his trading teeth in the days before PCs.
As well as his work in the financial world, he has launched, run and sold several 'real' businesses producing 'real' products.
-
 UK interest rates live: rates held at 3.75%
The Bank of England’s Monetary Policy Committee (MPC) met today to decide UK interest rates, and voted to hold rates at their current level
-
 MoneyWeek Talks: The funds to choose in 2026
Podcast Fidelity's Tom Stevenson reveals his top three funds for 2026 for your ISA or self-invested personal pension