The Dow has struck one of my targets
The Dow has hit one of John C Burford's target tramlines, but he's not taking profits just yet. Here, he explains why.
Get the latest financial news, insights and expert analysis from our award-winning MoneyWeek team, to help you understand what really matters when it comes to your finances.
You are now subscribed
Your newsletter sign-up was successful
Want to add more newsletters?

Twice daily
MoneyWeek
Get the latest financial news, insights and expert analysis from our award-winning MoneyWeek team, to help you understand what really matters when it comes to your finances.

Four times a week
Look After My Bills
Sign up to our free money-saving newsletter, filled with the latest news and expert advice to help you find the best tips and deals for managing your bills. Start saving today!
In recent days, I have been swinging between covering gold and the Dow and ignoring the euro. This is because I really have nothing new to say about the euro the market has been working lower for a month now towards my major target as the US dollar has been gaining strength (contrary to much learned opinion, please note).
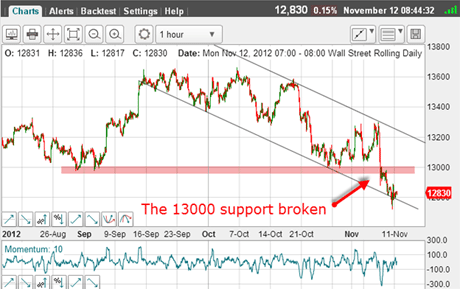
But action in the Dow has been anything but normal. In Monday'spost, this was the picture:
(Click on the chart for a larger version)
MoneyWeek
Subscribe to MoneyWeek today and get your first six magazine issues absolutely FREE

Sign up to Money Morning
Don't miss the latest investment and personal finances news, market analysis, plus money-saving tips with our free twice-daily newsletter
Don't miss the latest investment and personal finances news, market analysis, plus money-saving tips with our free twice-daily newsletter
The critical 13,000 support level had been decisively broken and that alone would have been a great reason to take a short trade.
And this week, the market has dropped back down to my lower tramline.
I had expected at least a partial bounce back to try for the underside of the 13,000 pink zone. But Mr Market was in full flight down and since I believe we are in a very large third wave and these are generally relentless in their thrust this was totally in keeping with my interpretation.
Why I'm breaking my own rule
(Click on the chart for a larger version)
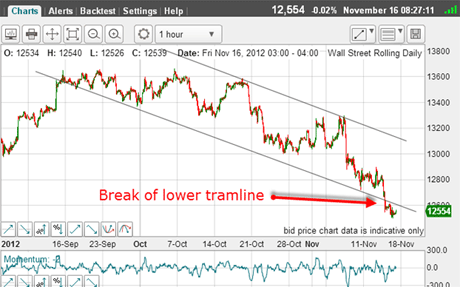
On Wednesday, the market moved sharply lower and broke below my lower tramline.
Now, this tramline is not terribly secure because it has few touch points, especially in recent trading (only one!). I may have to adjust its position.
Not only that, but my upper line only sports two touch points also not a terribly secure line. I would have preferred at least three.
I am not relying on these too much until I see more chart work. That is why I am not yet taking my short trade off the table, as is my rule for when the market hits or overshoots the lower tramline.
Has anyone noticed the Dow dip?
I have a short swing trade working from the 13,250 area and I will need more evidence to give me a reason to take profits. Where can that come from?
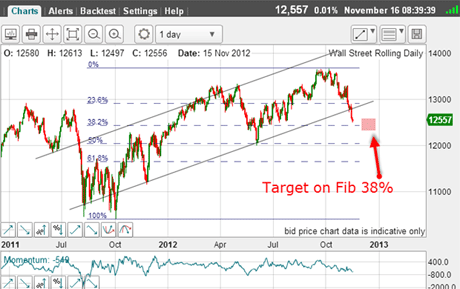
Here is the updated daily chart showing the Fibonacci retraces:
(Click on the chart for a larger version)
I have taken the October 2011 low as my low pivot point, and observe how the 4 June low lies exactly on the Fibonacci 50% level and that was before the recent highs were put in! I see this phenomenon frequently and when I do, it gives me confidence in the targets I derive from these Fibonacci levels.
Trade tip:Look out for these events, which can occur in any time frame.
The market is heading for the 38% level (pink zone) at the 12,450 area.
There is one thing I currently find remarkable: I have scanned the media and cannot find a reference to the fact that the Dow has lost over 1,000 points in about a month. Am I the only person to have noticed?
And this brings up the question of sentiment. In the media at least, there is little discomfort at this large "dip".
I have recently written about sudden changes of sentiment with my frozen pond story. My question is: has the bullish sentiment suddenly reversed?
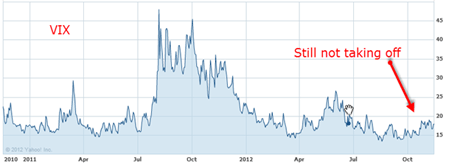
To help answer this, I turn to the VIX measure of fear:
(Source: Yahoo! Finance - Click on the chart for a larger version)
Even with this 1,000-point dip', the VIX is only just getting up off the floor (where it was on the summer rally). A low reading indicates complacency and a high one indicates panic (usually a selling panic as in October 2011!).
All of this is telling me that there is little fear of a major rout out there.
Could there be a major sentiment change?
But is the market ripe for a major change in trend?Here is the latest committmentsof traders(COT) data:
| OPEN INTEREST: 51,112 | ||||||||
| COMMITMENTS | ||||||||
| 14,735 | 6,462 | 1,859 | 26,955 | 38,500 | 43,549 | 46,820 | 7,564 | 4,293 |
| CHANGES FROM30/10/12 (CHANGE IN OPEN INTEREST: -2,725) | ||||||||
| -1,737 | -2,226 | 769 | -894 | -1,467 | -1,862 | -2,924 | -863 | 199 |
| PERCENT OF OPEN INTEREST FOR EACH CATEGORY OF TRADERS | ||||||||
| 28.8 | 12.6 | 3.6 | 52.7 | 75.3 | 85.2 | 91.6 | 14.8 | 8.4 |
| NUMBER OF TRADERS IN EACH CATEGORY (TOTAL TRADERS: 92) | ||||||||
| 26 | 14 | 6 | 36 | 27 | 65 | 44 | Row 8 - Cell 7 | Row 8 - Cell 8 |
The large speculators (aka hedge funds) are still better thantwo-to-onelong, while the small speculators are almosttwo-to-one long. The changes in the week are interesting. The hedgies reduced their longs (expected in a decline), but also reduced their shorts by a massive 25% - just before this week's big swoon!
That's called timing very bad timing. But the little guys are getting it right they reduced their longs and increased their shorts.
Because of the small sample size, I cannot take this data too seriously, but I believe it adds to the case for a major sentiment change, which is also supported by the latest AAII data. Remember, this is a survey of US 'mom and pop investors' who are more likely to be in the trenches of the real economy than hedge fund managers:
| Bullish | 29% | -10% | 39% |
| Bearish | 49% | +9% | 30% |
| Neutral | 22% | +1% | 31% |
I find these numbers staggering. There has been a weekly swing of almost 20% to the bearish cause. Maybe they have noticed the 1000-point Dow dip' too.
The other fascinating point is that the neutrals are only at 22% - a full 9% below the long-term average. This is getting into record low territory I believe, and surely indicates that the markets are getting even more polarised as is the entire world.
Last time, I had a possible Elliott wave picture for this move down. I may have to make a major adjustment for the wave 1 low!
If you're a new reader, or need a reminder about some of the methods I refer to in my trades, then do have a look at my introductory videos:
The essentials of tramline trading
An introduction to Elliott wave theory
Advanced trading with Elliott waves
Don't miss my next trading insight. To receive all my spread betting blog posts by email, as soon as I've written them, just sign up here . If you have any queries regarding MoneyWeek Trader, please contact us here.
Get the latest financial news, insights and expert analysis from our award-winning MoneyWeek team, to help you understand what really matters when it comes to your finances.
John is is a British-born lapsed PhD physicist, who previously worked for Nasa on the Mars exploration team. He is a former commodity trading advisor with the US Commodities Futures Trading Commission, and worked in a boutique futures house in California in the 1980s.
He was a partner in one of the first futures newsletter advisory services, based in Washington DC, specialising in pork bellies and currencies. John is primarily a chart-reading trader, having cut his trading teeth in the days before PCs.
As well as his work in the financial world, he has launched, run and sold several 'real' businesses producing 'real' products.
-
 MoneyWeek news quiz: Can you get smart meter compensation?
Smart meter compensation rules, Premium Bonds winners, and the Bank of England’s latest base rate decision all made the news this week. How closely were you following it?
-
 Adventures in Saudi Arabia
Travel The kingdom of Saudi Arabia in the Middle East is rich in undiscovered natural beauty. Get there before everybody else does, says Merryn Somerset Webb