The Dow follows my script – so far
The rally in the Dow has followed John C Burford's tramline predictions to the letter. But as the market shows signs of topping, where will he set his next target?
Get the latest financial news, insights and expert analysis from our award-winning MoneyWeek team, to help you understand what really matters when it comes to your finances.
You are now subscribed
Your newsletter sign-up was successful
Want to add more newsletters?

Twice daily
MoneyWeek
Get the latest financial news, insights and expert analysis from our award-winning MoneyWeek team, to help you understand what really matters when it comes to your finances.

Four times a week
Look After My Bills
Sign up to our free money-saving newsletter, filled with the latest news and expert advice to help you find the best tips and deals for managing your bills. Start saving today!
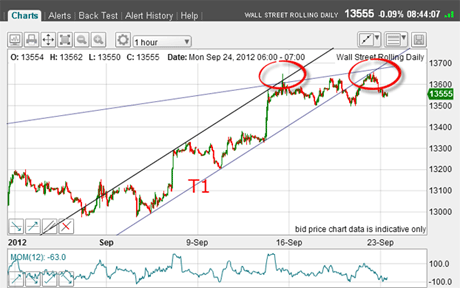
On Monday, I left the Dow hanging in space after it had made a crucial kiss of an important tramline.
If you remember, I was looking for a big move down and believed Friday's high was a major one see the chart below:
The shallow tramline is my long-term line on the daily chart. As you can see, the market made those two attempts to break the back of the resistance offered by the crossing of this line and the short-term upper tramline and then T1.
MoneyWeek
Subscribe to MoneyWeek today and get your first six magazine issues absolutely FREE

Sign up to Money Morning
Don't miss the latest investment and personal finances news, market analysis, plus money-saving tips with our free twice-daily newsletter
Don't miss the latest investment and personal finances news, market analysis, plus money-saving tips with our free twice-daily newsletter
At the time, I noted the T1 kiss and the budding scalded cat bounce.

(Click on image above for larger version)
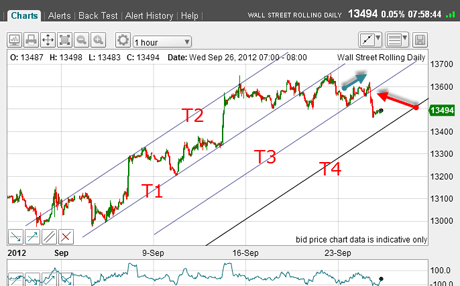
But what I did not show on this chart was my third tramline below T1, equidistant as always, which would be my first tramline target. Of course, being a diligent student, I have every confidence you had done that without my prompting!
Dow busts through my lower tramline
So how did that work out after I wrote Monday's post?

(Click on image above for larger version)
As expected, the market declined to T3, my third tramline, and then ran alongside it (blue arrow). But late yesterday, heavy selling forced a break of T3 (red arrow) and is now heading for my second target at T4. Nice.
This action has sharply increased my confidence in the tramlines I have drawn.
Trader tip: Using my methods of tramlines, Fibonacci retraces and Elliott waves, you should be in little doubt what to expect in market action near-term. Here, after drawing my first two tramlines on Monday, I had my first downside target at T3 which was drawn in advance.
Short-term traders can use these targets to take profits, of course. Longer-term traders can use these tramline targets as signs along the way to much deeper targets signs that help confirm your forecasts. This gives you greater confidence you are in a good trade you are not floundering around in the dark, as so many traders are. You have a reasonably clear vision of what your trade is capable of giving you. That is valuable input.
Look how Fibonacci marks the support
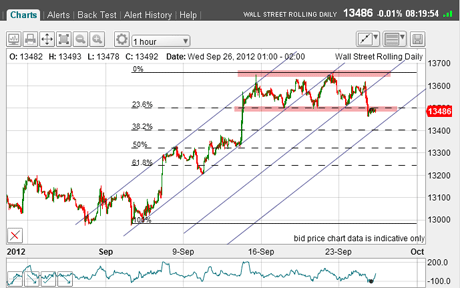
OK, I have a short trade going my way, so far. What do my Fibonaccis tell me?

(Click on image above for larger version)
Here are the Fibonacci retrace levels of the latest upswing from the 4 September low. Is it a coincidence that the 23% retrace level has also acted as the major support (pink bar) of the large consolidation zone between 13,500 and 13,650? I think not.
As I write, the market has rallied slightly to the underside of the pink resistance/Fibonacci 23% level. If this resistance holds, then it's on our way down towards T4.
OK, I have my short-term picture in focus, let's step back and see where this fits into the bigger picture.
The odds favour a bigger fall from here
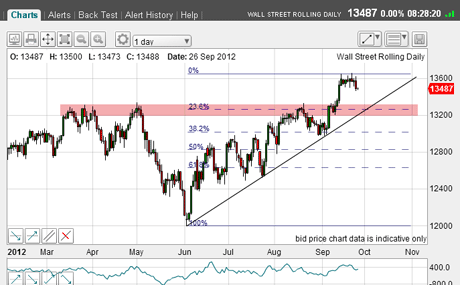
This is the daily chart:

(Click on image above for larger version)
I have my major pivot point as the 4 June low and I have drawn in my Fibonacci levels of the big swing since June.
Also, I still have my major uptrend line working. This is the lower line of the large rising wedge (triangle) I have previously shown.
The pink bar is the chart support zone from the major March and May highs.
And note that all three support areas meet in the 13,300 region. That will be the first major target for longer-term traders.
So it appears that we have seen a major top last Friday at 13,660 but keep in mind it is not necessarily the top. To me, the odds are now very much swinging in favour of a large down move in the short term. Trading from the short side is now indicated.
If you're a new reader, or need a reminder about some of the methods I refer to in my trades, then do have a look at my introductory videos:
The essentials of tramline trading
An introduction to Elliott wave theory
Advanced trading with Elliott waves
Don't miss my next trading insight. To receive all my spread betting blog posts by email, as soon as I've written them, just sign up here . If you have any queries regarding MoneyWeek Trader, please contact us here.
Get the latest financial news, insights and expert analysis from our award-winning MoneyWeek team, to help you understand what really matters when it comes to your finances.
John is is a British-born lapsed PhD physicist, who previously worked for Nasa on the Mars exploration team. He is a former commodity trading advisor with the US Commodities Futures Trading Commission, and worked in a boutique futures house in California in the 1980s.
He was a partner in one of the first futures newsletter advisory services, based in Washington DC, specialising in pork bellies and currencies. John is primarily a chart-reading trader, having cut his trading teeth in the days before PCs.
As well as his work in the financial world, he has launched, run and sold several 'real' businesses producing 'real' products.
-
 Will fintechs change the way you invest?: MoneyWeek Talks
Podcast Fidelity's Tom Stevenson reveals his top three funds for 2026 for your ISA or self-invested personal pension
-
 Three companies with deep economic moats to buy now
Opinion An economic moat can underpin a company's future returns. Here, Imran Sattar, portfolio manager at Edinburgh Investment Trust, selects three stocks to buy now