Take a look at this key level on the Dow
The Dow has enjoyed a rigorous rally in recent months. But is the market now reaching the end of the road? John C Burford looks to the charts for clues.
Get the latest financial news, insights and expert analysis from our award-winning MoneyWeek team, to help you understand what really matters when it comes to your finances.
You are now subscribed
Your newsletter sign-up was successful
Want to add more newsletters?

Twice daily
MoneyWeek
Get the latest financial news, insights and expert analysis from our award-winning MoneyWeek team, to help you understand what really matters when it comes to your finances.

Four times a week
Look After My Bills
Sign up to our free money-saving newsletter, filled with the latest news and expert advice to help you find the best tips and deals for managing your bills. Start saving today!
TABLE.ben-table TABLE {BORDER-BOTTOM: #2b1083 1px solid; BORDER-LEFT: #2b1083 1px solid; BORDER-TOP: #2b1083 1px solid; BORDER-RIGHT: #2b1083 1px solid}TH {TEXT-ALIGN: center; BORDER-LEFT: #a6a6c9 1px solid; PADDING-BOTTOM: 2px; PADDING-LEFT: 1px; PADDING-RIGHT: 1px; BACKGROUND: #2b1083; COLOR: white; FONT-SIZE: 0.8em; FONT-WEIGHT: bold; PADDING-TOP: 2px}TH.first {TEXT-ALIGN: left; BORDER-LEFT: 0px; PADDING-BOTTOM: 2px; PADDING-LEFT: 1px; PADDING-RIGHT: 1px; FONT-SIZE: 0.8em; PADDING-TOP: 2px}TR {BACKGROUND: #fff}TR.alt {BACKGROUND: #f6f5f9}TD {TEXT-ALIGN: center; BORDER-LEFT: #a6a6c9 1px solid; PADDING-BOTTOM: 2px; PADDING-LEFT: 1px; PADDING-RIGHT: 1px; COLOR: #000; FONT-SIZE: 0.8em; PADDING-TOP: 2px}TD.alt {BACKGROUND-COLOR: #f6f5f9}TD.bold {FONT-WEIGHT: bold}TD.first {TEXT-ALIGN: left}TD.left {TEXT-ALIGN: left}TD.bleft {TEXT-ALIGN: left; FONT-WEIGHT: bold}
We spent all last week and most of the week before following the Aussie dollar. It's not one of my staple markets. But as I hope you saw, it threw up some excellent examples of how you can use my tramline methods.
And in fact, when you get the hang of these techniques, you'll see that you can use them on a wide range of markets. If you're having some success in any markets I don't normally cover, I'd love to hear about them.
MoneyWeek
Subscribe to MoneyWeek today and get your first six magazine issues absolutely FREE

Sign up to Money Morning
Don't miss the latest investment and personal finances news, market analysis, plus money-saving tips with our free twice-daily newsletter
Don't miss the latest investment and personal finances news, market analysis, plus money-saving tips with our free twice-daily newsletter
Today though, I want to return to one of my old favourites: the Dow. There are some terrific tramlines building up here as well.
On 14 September I talked about my line in the sand for the Dow, where the market was trading around the 13,550 region. And as I glance at my screen this morning, the market is trading at 13,550, having been slightly higher than this to last week's high just above the 13,600 level.
The market is playing with me and my line in the sand!
Dow still tracking my long-term tramline
After such a vigorous rally in recent months, can I find any clues that the Dow rally is approaching the end of the road?
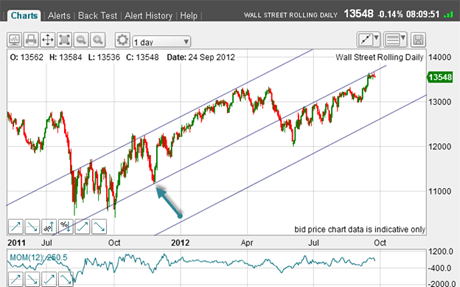
First, let's update my daily chart showing the long-term tramlines I am working to:

(Click on image above for larger version)
I am retaining the November 2011 touch-point (blue arrow) to base my main tramline, which the market has been running up alongside since early summer.
So, this tramline has not yet been penetrated to the upside. That is point number one. The rally is still on borrowed time and crucially, is getting long in the tooth without a major set-back.
As an aside, the VIX reading is near its all-time low, indicating high levels of complacency among option traders.
Point number two is my upper tramline. This is by no means perfect, but is a good working line, as it has many touch-points. Meanwhile, my lowest tramline is new and is, of course, equidistant from the centre line.
That is my main first target if the effort to break above the centre tramline fails.
Traders are overwhelmingly bullish
The big question is: with the rally firmly established, can I expect a reversal near current levels?
For another clue, let's see what the latest Commitments of Traders (COT) data can give us:
| OPEN INTEREST: 151,710 | ||||||||
| COMMITMENTS | ||||||||
| 51,001 | 11,944 | 3,262 | 78,299 | 122,798 | 132,562 | 138,004 | 19,148 | 13,706 |
| CHANGES FROM 09/11/12 (CHANGE IN OPEN INTEREST: 25,762) | ||||||||
| 7,319 | 163 | 1,484 | 16,679 | 22,341 | 25,482 | 23,988 | 280 | 1,774 |
| PERCENT OF OPEN INTEREST FOR EACH CATEGORY OF TRADERS | ||||||||
| 33.6 | 7.9 | 2.2 | 51.6 | 80.9 | 87.4 | 91.0 | 12.6 | 9.0 |
| NUMBER OF TRADERS IN EACH CATEGORY (TOTAL TRADERS: 105) | ||||||||
| 33 | 13 | 8 | 44 | 35 | 82 | 52 | Row 8 - Cell 7 | Row 8 - Cell 8 |
I find this data staggering just focus on the changes for the previous week.
The large non-commercials (hedge funds) are holding more than four long contracts for every one short. And the increase of 7,300 in longs (as the rally progressed) is a large 17%.
That is herding in action. The professionals are making the classic error of getting more bullish as the market rallies.
Remember, markets always make major tops when sentiment becomes too bullish amongst the speculators (non-commercials and non-reportables).
At my workshop, I show how this works and how it can tell you when a trend is likely to turn, based on sentiment readings. This is valuable information to have as a trader.
The market is ripe for a reversal
Note also that the commercials (banks and genuine hedgers) increased their shorts more than their longs. These are the strong hands.
But the non-reportables ie, 'small traders' (you and me) were getting cold feet holding so many longs, and some even went net short.
This is backing up what I have been saying the market professionals are hugely bullish, while 'moms and pops' are much more ambivalent. Maybe they see what is happening on the ground in the real economy weak growth and high unemployment while the professionals only see a rising market and don't want to be left out, especially at bonus time.
Also, remember that there is massive quantitative easing (QE) liquidity at the disposal of the professionals with no place to go, except into asset markets, such as stocks. Private investors have no such funds to play with!
Conclusion: the market is ripe for a reversal at any time.
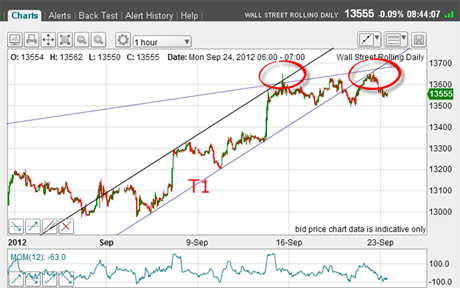
So now, let's look at the short-term picture on the hourly:

(Click on image above for larger version)
I can draw a lovely tramline pair enclosing the rally from the 4 September low. My upper tramline of this pair is not so great, as the start of it is rather messy. But don't blame me that is the market's fault! It gets better later.
The first important point is that when my upper tramline met the shallower long-term daily tramline (see first chart above), it hit a brick wall and the market retreated back down to T1.
Another attempt to break up through was repelled, and crucially, the market broke below T1 on Thursday my second important point.
This was the first sign of a possible turn.
On Friday, we had the classic rally to kiss the underside of T1 and now what looks suspiciously like a scalded cat bounce down. Hmm.
So now my confidence in my line in the sand is enhanced at around current levels. It is put up or shut up time for the bulls.
Why 13,500 could be a crucial level
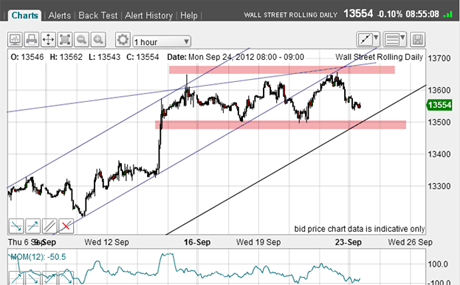
So, which way will the market break out of its current trading range between 13,650 and 13,500 (pink bars)?

(Click on image above for larger version)
Good question! But note the 13,500 area (where my third tramline and the lower pink support bar meet). If the market breaks below that, the selling should be intense, as hedge funds liquidate positions (remember, they have four longs for every short).
I expect the 13,500 level to be challenged very soon (later today?). I will be watching it with eagle eyes.
If you're a new reader, or need a reminder about some of the methods I refer to in my trades, then do have a look at my introductory videos:
The essentials of tramline trading
An introduction to Elliott wave theory
Advanced trading with Elliott waves
Don't miss my next trading insight. To receive all my spread betting blog posts by email, as soon as I've written them, just sign up here . If you have any queries regarding MoneyWeek Trader, please contact us here.
Get the latest financial news, insights and expert analysis from our award-winning MoneyWeek team, to help you understand what really matters when it comes to your finances.
John is is a British-born lapsed PhD physicist, who previously worked for Nasa on the Mars exploration team. He is a former commodity trading advisor with the US Commodities Futures Trading Commission, and worked in a boutique futures house in California in the 1980s.
He was a partner in one of the first futures newsletter advisory services, based in Washington DC, specialising in pork bellies and currencies. John is primarily a chart-reading trader, having cut his trading teeth in the days before PCs.
As well as his work in the financial world, he has launched, run and sold several 'real' businesses producing 'real' products.
-
 Average UK house price reaches £300,000 for first time, Halifax says
While the average house price has topped £300k, regional disparities still remain, Halifax finds.
-
 Barings Emerging Europe trust bounces back from Russia woes
Barings Emerging Europe trust has added the Middle East and Africa to its mandate, delivering a strong recovery, says Max King