My line in the sand for the Dow
Following the Dow's impressive rally, the moment of truth has arrived. Is the market due a turn-around? John C Burford looks to the charts for clues.
Get the latest financial news, insights and expert analysis from our award-winning MoneyWeek team, to help you understand what really matters when it comes to your finances.
You are now subscribed
Your newsletter sign-up was successful
Want to add more newsletters?

Twice daily
MoneyWeek
Get the latest financial news, insights and expert analysis from our award-winning MoneyWeek team, to help you understand what really matters when it comes to your finances.

Four times a week
Look After My Bills
Sign up to our free money-saving newsletter, filled with the latest news and expert advice to help you find the best tips and deals for managing your bills. Start saving today!
As I'm sure you've seen, the Dow spiked up yesterday following the Fed's announcement of a third round of quantitative easing. In fact, the markets held their gains, and are still rising this morning as I write.
My guess on Wednesday was that the spike would see a top in some sort in a buy the rumour, sell the news' type of action.
Instead, we have got a buy the rumour, buy the news' move! At least, for now...
MoneyWeek
Subscribe to MoneyWeek today and get your first six magazine issues absolutely FREE

Sign up to Money Morning
Don't miss the latest investment and personal finances news, market analysis, plus money-saving tips with our free twice-daily newsletter
Don't miss the latest investment and personal finances news, market analysis, plus money-saving tips with our free twice-daily newsletter
My plan of action today on the Dow: do nothing
For someone who is long-term bearish on the stock market, as I have been, this is uncomfortable. I'm sure I'm not alone in being wrong-footed on this rally all traders are, at times, in this situation.
But the key action for me is to do nothing: stand back outside of the markets and just observe.
For many traders, the temptation would be to throw in the towel and join the crowd usually at the worst time when the trend is about to end!
Picture the scene. You feel a loss as you missed out on a good move and then you finally jump on it just before a reversal. Result? Another loss! You would have suffered a double whammy and that could knock the stuffing out of your confidence. It may be some time before you recovered and you could miss good trades in the meantime.
The best mental position for a trader is one of balance. The worst is being under stress. Avoid stress as much as possible.
Trader tip: The number one rule of trading for me is this: when you are in a losing trade, make sure your loss is as small as possible. That way, you retain the bulk of your account for you to fight another day. The winning trades will come along in due course where you can make hay. That is the point of using tight money management discipline, such as my 3% rule and break-even rule. Plan your losses as much as you plan your entries.
By the way, I'd like to share something with you that I've picked up during my decades of trading the markets
I've found that after a market-changing event such as we have seen this week, it's often the day or two after the news release that can give clues as to the next move continuation or termination of the rally.
So I'll be watching the action closely today and Monday for signs of a turn. I'll tell you what I see in coming issues of MoneyWeek Trader. Don't miss an issue I think we'll get some great lessons.
Let's check in on the tramlines
Meanwhile, with the Dow making almost exponential rallies, are my tramlines still operative? Or do I need to wait for new tramline patterns to develop?
Trader tip: All methods, at times, become temporarily useless at analysing the current markets and my tramline trading system is no exception. That's OK. When a system works the vast majority of the time, a little breakdown once in a while shouldn't take you out of the game. But when the fog does clear, that is when the method is truly valuable again.
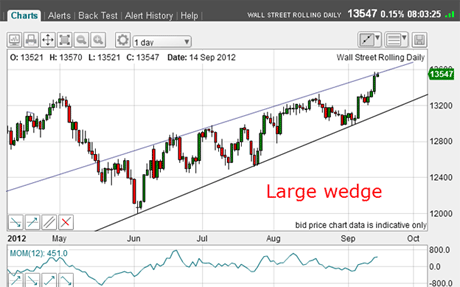
So let's take a look at the daily Dow chart:

(Click on image above for larger version)
The upper line is the trendline drawn off the major November 2011 low I have shown this in previous posts.
The lower line connects the three major lows. Between them, we have a large wedge formation.
Yesterday's rally has carried right to this upper line. If the rally peters out, this would be a great area for it to occur. Remember, most rising wedges resolve downwards.
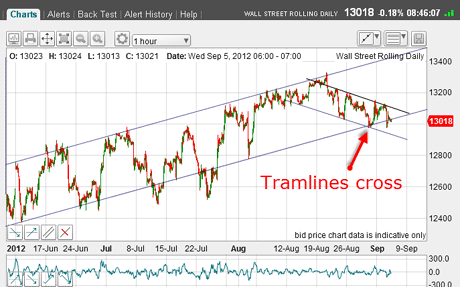
But recall my last Dowpost on 5 September where I noted two competing shorter-term tramlines had crossed and good support was emerging. This was the chart I showed then:

(Click on image above for larger version)
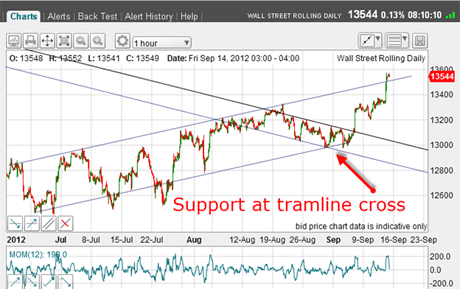
And this is the chart this morning:

(Click on image above for larger version)
I also said in that 5 September post: "If the market catches another bid and rallies above the 13,150 area (above the upper tramline in my second chart), I would definitely reconsider my stance"
We now know that this indeed did occur with a 500-pip rally!
We've reached my line in the sand
But now, with the market having moved slightly above my upper tramline in the above chart and having hit my upper wedge line this is the moment of truth for the rally.
In other words, we have reached my line in the sand.
Later today, we will see the release of important US economic data. Could these be a trigger for a turn-around? Keep watching.
There is no doubt that stock prices are increasingly diverging from what is occurring in the real US economy. We are in a period where bad news (poor job numbers) is good for shares. We have been in this topsy-turvy world before!
But eventually, people will notice the emperor really has no clothes.
Meanwhile, the bulls are enjoying the action, but for how much longer? And will they be able to spot the inevitable turn and book profits, or will they do what most traders/investors do and make the ride up and then back down again?
That is what happened to the famous trader of times past, Jesse Livermore, who made fortunes in the stock market and then lost them again.
For a hair-raising account of what life was like in the free-wheeling days of yore before the FSA and SEC, I highly recommend Reminiscences of a Stock Operator, which should be on every trader's bookshelf.
What do you make of the Dow action? If you haveany observations to share with the group, we'd love to hear them. Have your say below.
If you're a new reader, or need a reminder about some of the methods I refer to in my trades, then do have a look at my introductory videos:
The essentials of tramline trading
An introduction to Elliott wave theory
Advanced trading with Elliott waves
Don't miss my next trading insight. To receive all my spread betting blog posts by email, as soon as I've written them, just sign up here . If you have any queries regarding MoneyWeek Trader, please contact us here.
Get the latest financial news, insights and expert analysis from our award-winning MoneyWeek team, to help you understand what really matters when it comes to your finances.
John is is a British-born lapsed PhD physicist, who previously worked for Nasa on the Mars exploration team. He is a former commodity trading advisor with the US Commodities Futures Trading Commission, and worked in a boutique futures house in California in the 1980s.
He was a partner in one of the first futures newsletter advisory services, based in Washington DC, specialising in pork bellies and currencies. John is primarily a chart-reading trader, having cut his trading teeth in the days before PCs.
As well as his work in the financial world, he has launched, run and sold several 'real' businesses producing 'real' products.
-
 MoneyWeek Talks: The funds to choose in 2026
Podcast Fidelity's Tom Stevenson reveals his top three funds for 2026 for your ISA or self-invested personal pension
-
 Three companies with deep economic moats to buy now
Opinion An economic moat can underpin a company's future returns. Here, Imran Sattar, portfolio manager at Edinburgh Investment Trust, selects three stocks to buy now