Great trades available on Dow tramlines
With several sets of tramlines to choose from, John C Burford finds some excellent low-risk short trades in the Dow Jones.
Get the latest financial news, insights and expert analysis from our award-winning MoneyWeek team, to help you understand what really matters when it comes to your finances.
You are now subscribed
Your newsletter sign-up was successful
Want to add more newsletters?

Twice daily
MoneyWeek
Get the latest financial news, insights and expert analysis from our award-winning MoneyWeek team, to help you understand what really matters when it comes to your finances.

Four times a week
Look After My Bills
Sign up to our free money-saving newsletter, filled with the latest news and expert advice to help you find the best tips and deals for managing your bills. Start saving today!
I know I promised to cover gold this week, and I will do so on Friday. I have a feeling there will be some important developments over there by then.
Meanwhile, in my 24 August article The Dow starts its big move down, I deliberately made that headline provocative and definitive.
What if I was wrong and the Dow continued its amazing rally into new highs above the 13,300 area? I would certainly have egg on my face. That was certainly possible!
MoneyWeek
Subscribe to MoneyWeek today and get your first six magazine issues absolutely FREE

Sign up to Money Morning
Don't miss the latest investment and personal finances news, market analysis, plus money-saving tips with our free twice-daily newsletter
Don't miss the latest investment and personal finances news, market analysis, plus money-saving tips with our free twice-daily newsletter
But I had several good reasons for believing the top was in one was the statistically significant observation that many of the stock market's big crashes occur in the September-October period.
Incidentally, I was in front of a Quotron screen (how quaint!) when the massive October 1987 crash happened so this period is forever emblazoned in my memory. And every year, I look for signs of a repeat performance, or at least a decent down market.
The interesting thing about these crashes is that the actual tops were made in July and August! These are usually the very best months for shorting.
As September wore on many of the crashes ate away at support, before the floodgates opened with several teasing rallies but not to new highs.
So far this year, we have a probable Dow top in August, and the market is currently edging down. Hmm.
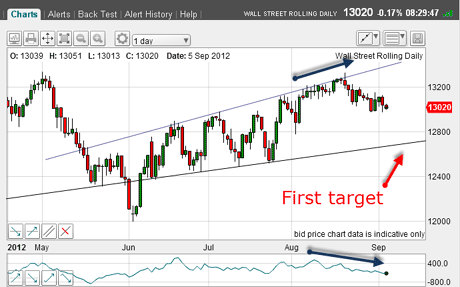
Last time, I showed the small and large wedge patterns and here is the large wedge chart updated:

(Click on the chart for a larger version)
As I noted before, the market poked momentarily above the upper line and then backed off a bearish sign.
Also, note the weakening momentum into the last phase of the rally (blue arrows) another bearish sign.
These are the major reasons why I suspected the 13,300 area was the top and told me to trade from the short side.
The ideal place to enter a short trade
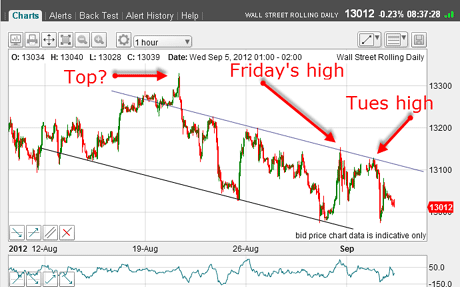
But for swing trading, we need a shorter timeframe to find low-risk precision entries and a search for good working tramlines. Here is the hourly chart as of this morning:

(Click on the chart for a larger version)
And here they are! On Friday, before the Bernanke rally, the market had made a new low, and I was then able to draw in my lower tramline, since I had enough touch-points.
Then still on Friday I could draw in my upper tramline, since the touch-points were very obvious.
So that upper line was the probable turning point for any rally. As it happened, the Fed gave me that rally. And it carried up to my upper tramline and stopped.
That was an ideal place to enter a low-risk short trade.
Last time, I suggested the move off the top could be an A-B-C corrective move with new highs beckoning. With Friday's new low (the post-Bernanke low) below the previous low, that possibility greatly diminished.
Two tramlines are slugging it out
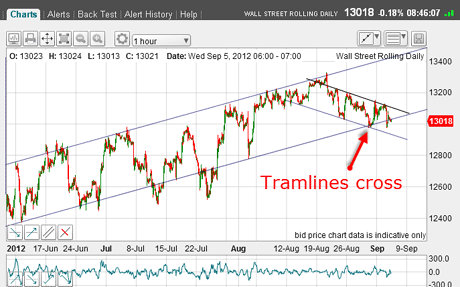
But that is not all. At any time, there may be several tramline patterns working and that is something all tramline traders must keep in mind. And I found another set:

(Click on the chart for a larger version)
These are my competing up-sloping tramlines which contain many good touch-points. Note how the market rallied on Friday as it touched the crossing of the two lower tramlines.
These tramline crossings are often powerful areas of support and so it proved here.
But with the market backing down, challenging the lower up-sloping tramline in the 13,100 area, we are in a waiting phase. The two tramline patterns are slugging it out!
So now I have my second short trade working (the first was in the 13,270 area). What are the areas of concern to me?
If the market catches another bid and rallies above the 13,150 area (above the upper tramline in my second chart), I would definitely reconsider my stance.
But for now, the market is going my way, and I believe a move towards my first target (first chart) in the 12,700 area is likely. That is the lower large wedge line and where support has occurred before.
But if we are in an Elliott third wave down in several degrees of trend, I expect a generous collapse in this September-October period. Hold onto your hats!
If you're a new reader, or need a reminder about some of the methods I refer to in my trades, then do have a look at my introductory videos:
The essentials of tramline trading
An introduction to Elliott wave theory
Advanced trading with Elliott waves
Don't miss my next trading insight. To receive all my spread betting blog posts by email, as soon as I've written them, just sign up here . If you have any queries regarding MoneyWeek Trader, please contact us here.
Get the latest financial news, insights and expert analysis from our award-winning MoneyWeek team, to help you understand what really matters when it comes to your finances.
John is is a British-born lapsed PhD physicist, who previously worked for Nasa on the Mars exploration team. He is a former commodity trading advisor with the US Commodities Futures Trading Commission, and worked in a boutique futures house in California in the 1980s.
He was a partner in one of the first futures newsletter advisory services, based in Washington DC, specialising in pork bellies and currencies. John is primarily a chart-reading trader, having cut his trading teeth in the days before PCs.
As well as his work in the financial world, he has launched, run and sold several 'real' businesses producing 'real' products.
-
 Pension Credit: should the mixed-age couples rule be scrapped?
The mixed-age couples rule was introduced in May 2019 to reserve pension credit for older households but a charity warns it is unfair
-
 Average income tax by area: The parts of the UK paying the most tax mapped
The UK’s total income tax bill was £240.7 billion 2022/23, but the tax burden is not spread equally around the country. We look at the towns and boroughs that have the highest average income tax bill.