The Dow starts its big move down
The bull market in the Dow is starting to show signs of nerves. The market is primed for a fall, says John C Burford. But how far will it go?
Get the latest financial news, insights and expert analysis from our award-winning MoneyWeek team, to help you understand what really matters when it comes to your finances.
You are now subscribed
Your newsletter sign-up was successful
Want to add more newsletters?

Twice daily
MoneyWeek
Get the latest financial news, insights and expert analysis from our award-winning MoneyWeek team, to help you understand what really matters when it comes to your finances.

Four times a week
Look After My Bills
Sign up to our free money-saving newsletter, filled with the latest news and expert advice to help you find the best tips and deals for managing your bills. Start saving today!
Before I get going on the subject of today's post, I want to set the record straight about the nature of my MoneyWeek Trader posts.
I noted two negative comments following my Wednesdaypost: The Dow edges up, but are we near the top?, and I wish to address them to clear up any confusion out there.
Here is a comment from Beasties: "The only time I've EVER placed a trade on an actual recommendation (extremely rare as they are!) from John the trade moved in the opposite direction from his analysis BIG TIME. He wasn't even close to being right."
MoneyWeek
Subscribe to MoneyWeek today and get your first six magazine issues absolutely FREE

Sign up to Money Morning
Don't miss the latest investment and personal finances news, market analysis, plus money-saving tips with our free twice-daily newsletter
Don't miss the latest investment and personal finances news, market analysis, plus money-saving tips with our free twice-daily newsletter
While I will be the first to admit that I do not get everything right in my analysis, all readers must understand that I am not giving specific trading advice. My free-to-you email service is NOT a tipping service. We may be offering that service shortly if enough readers want it.
This service is aimed purely at educating anyone on how they can profitably use the methods I use. I illustrate my methods using real-time examples. I write theposts before 9am and you receive them, following checking and preparation at the MoneyWeek office, in the afternoon.
Because I cover the markets up to around 9am, the charts you see will be updated to that time. When you receive that day's email, you can easily check for yourself what the market has done in the meantime. You can then, as a diligent student, find your own tramlines, Fibonacci retracements,or Elliott waves based on what I have done.
The idea is that an interested trader can learn how to use my methods for themselves very rapidly. My methods are simple and I want everyone who reads the MoneyWeek Traderposts to be winners. That way, you will stay trading for a long time and keep your spread-betting firm happy after all, they want long-lived clients. It does them no good for anyone to blow themselves up and lose a customer.
Another misconception is this: spread-betting companies make their profits off your losing trades. They make it by offering the buy/sell spread. They hedge their net exposure in the futures markets to reduce their risk. Of course, the more trades you do, the more profit they make off you, just like a stock broker who charges commissions. But how often you trade is entirely in your hands. It is an open and honest arrangement.
13,100 for one of the most powerful trend-change indicators
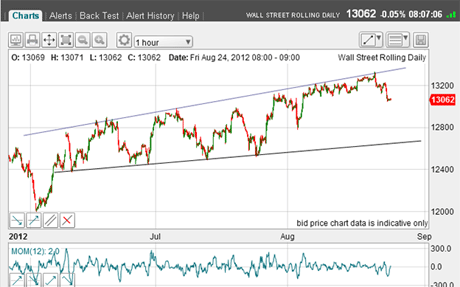
OK, so how is my Dow trade working from Wednesday? Then, I showed the expanding wedge on the hourly chart and this is the update:
(Click on the image above for a larger version)
The market briefly touched the upper wedge line on Tuesday at the 13,330 level, and since then, has bounced off it like a scalded cat.
Recall I placed a short trade at the 13,270 area on Tuesday and now my protective stop is at break-even.
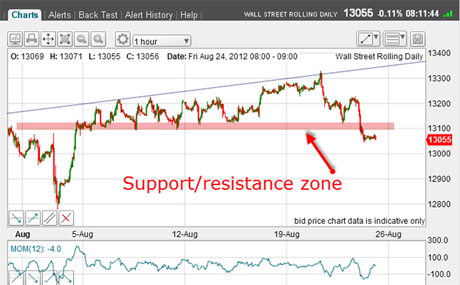
So let's zoom in on the finer detail. Remember on Wednesday, I said that the 13,100 area was significant and to watch it closely?
(Click on the image above for a larger version)
The first reason is that the 13,100 area (pink bar) represents massive support from the congestion zone since 5 August. All attempts to push below this area were rebuffed until yesterday. Now, sell-stops are being hit under 13,100.
With the pink bar lying above the market, this area now becomes a resistance to rallies.
The second reason is that if the Dow can close below 13,100 today, we would have a weekly key reversal one of the most powerful indicators of a change of trend. I discussed this on Wednesday.
Time for a long, strong third wave?
So, it appears the market is being primed for the big move down that I have been waiting for.
Let's examine the Elliott wave implications here.
(Click on the image above for a larger version)
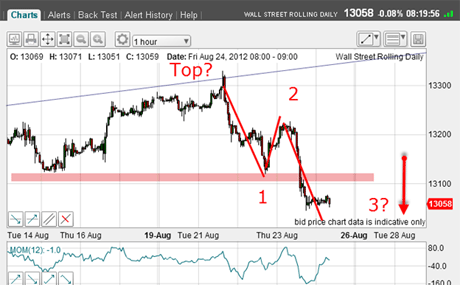
I have labelled the Tuesday high as the top. The first wave down is wave 1 and the rally (in a clear A-B-C form) is wave 2. The move below the 13,100 area yesterday puts it in contention for a big wave 3. Remember, these are usually long and strong.
But we must always keep in mind the alternative scenario that the move down off the top is an A-B-C, leading to a resumption of the uptrend.
For now, I believe the odds favour my first analysis. Why? For one thing, the public have become bullish on the rally (a bearish sign), and the internals (items such as put/call ratios, new highs/new lows, and so on) spell a bull market living on borrowed time. This is not a strong bull market. In fact, it is a very nervous one.
Just look at what occurred yesterday after release of the US Initial Unemplyment Claims data the figure was only slightly greater than expectations, and yet the market sold off sharply. That was nervousness.
To confirm my analysis, I need to see a rapid decline to extend the third wave down next week.
Wednesday's homework exercise
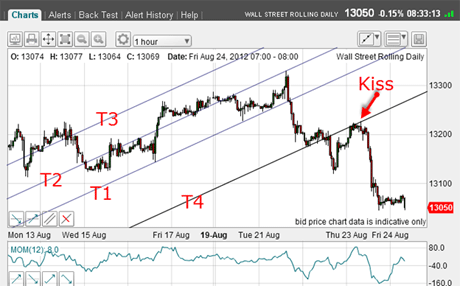
On Wednesday, I set a simple tramline quest.
(Click on the image above for a larger version)
I drew in T1 and T2, which I showed then. I could draw T3 equidistant and parallel. In Wednesday's post, the market had fallen to T4, which is equidistant from T1-T3.
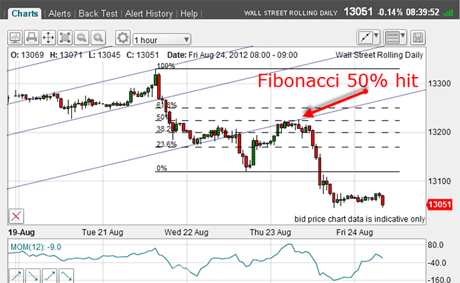
After a plunge down, the market rallied to kiss the underside of T4 a classic opportunity to enter short trades. And the market is extending its losses as I write.
The kiss also has hit a terrific Fibonacci level:
(Click on the image above for a larger version)
The combination of the kiss, the 50% hit, and the A-B-C form to the rally made this a compelling short trade just above 13,200.
The key level for me is the previous major low at 12,800 and then the lower wedge line at the 12,600 area.
I shall be watching for the big third wave next week!
If you're a new reader, or need a reminder about some of the methods I refer to in my trades, then do have a look at my introductory videos:
The essentials of tramline trading
An introduction to Elliott wave theory
Advanced trading with Elliott waves
Don't miss my next trading insight. To receive all my spread betting blog posts by email, as soon as I've written them, just sign up here . If you have any queries regarding MoneyWeek Trader, please contact us here.
Get the latest financial news, insights and expert analysis from our award-winning MoneyWeek team, to help you understand what really matters when it comes to your finances.
John is is a British-born lapsed PhD physicist, who previously worked for Nasa on the Mars exploration team. He is a former commodity trading advisor with the US Commodities Futures Trading Commission, and worked in a boutique futures house in California in the 1980s.
He was a partner in one of the first futures newsletter advisory services, based in Washington DC, specialising in pork bellies and currencies. John is primarily a chart-reading trader, having cut his trading teeth in the days before PCs.
As well as his work in the financial world, he has launched, run and sold several 'real' businesses producing 'real' products.
-
 ISA fund and trust picks for every type of investor – which could work for you?
Whether you’re an ISA investor seeking reliable returns, looking to add a bit more risk to your portfolio or are new to investing, MoneyWeek asked the experts for funds and investment trusts you could consider in 2026
-
 The most popular fund sectors of 2025 as investor outflows continue
It was another difficult year for fund inflows but there are signs that investors are returning to the financial markets