The Dow edges up, but are we near the top?
The recent rally in the Dow is showing all the signs of having run out of steam. John C Burford uses his trading methods to find out where to place his next trade.
Get the latest financial news, insights and expert analysis from our award-winning MoneyWeek team, to help you understand what really matters when it comes to your finances.
You are now subscribed
Your newsletter sign-up was successful
Want to add more newsletters?

Twice daily
MoneyWeek
Get the latest financial news, insights and expert analysis from our award-winning MoneyWeek team, to help you understand what really matters when it comes to your finances.

Four times a week
Look After My Bills
Sign up to our free money-saving newsletter, filled with the latest news and expert advice to help you find the best tips and deals for managing your bills. Start saving today!
In last Wednesday's post, I asked the question: Will the Dow break above my tramline and make a new yearly high?
Yesterday saw the rally extend, and the Dow did not quite make that new yearly high but the S&P did!
This is interesting. If you recall from late April/early May, the Dow eked out a new yearly high to complete a five-wave up sequence while the S&P did not. I was then confident that the 1 May high was a major top in the Dow.
MoneyWeek
Subscribe to MoneyWeek today and get your first six magazine issues absolutely FREE

Sign up to Money Morning
Don't miss the latest investment and personal finances news, market analysis, plus money-saving tips with our free twice-daily newsletter
Don't miss the latest investment and personal finances news, market analysis, plus money-saving tips with our free twice-daily newsletter
Since then, I have traded mainly from the short side and taken good swing profits, as highlighted in my posts.
But yesterday, the boot was on the other foot. The S&P's new high was a few pips above its March high, while the Dow missed its new high by a handful of pips.
This may become significant in the bigger picture.
The market is polarised
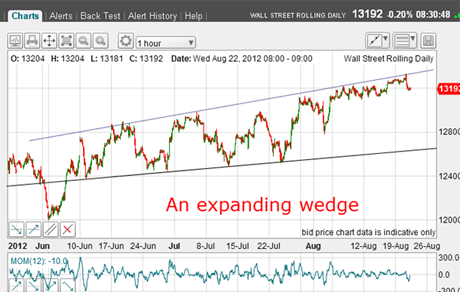
But first, let's take a look at the short-term chart:

(Click on the image above for a larger version)
On this hourly chart, there is a clear expanding wedge. This is a quite rare pattern, and has a different meaning from the usual converging type.
It is a reflection of the increasing polarisation in the market the widening gap between the bulls and the bears, as illustrated by the AAII sentiment data I show in these emails. Incidentally, this week the data show little change from the previous week, as the retail investors buy into the rally.
We know the bulls (mainly the professionals) are expecting another barrage of money-printing in QE operations which they infer will prop up share prices.
However, the game is changing on this front. Because in the past month or so, T-bond yields have shot up from their extreme lows (I have covered this in my T-bond posts), they must be getting more attractive as an alternative to shares.
So the connection between QE and rising stocks may not be as secure.
The bears, on the other hand, see a weak economic recovery, floundering eurozone policy-makers, and high share valuations. Not to mention the 'D words' debt and deflation.
So, out of this wedge whose upper line was touched briefly yesterday at the 13,330 high the market must resolve.
But which way?
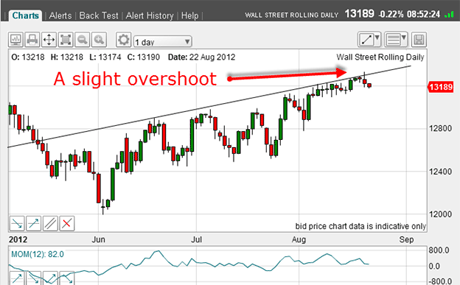
I have been following the progress of the market along my long-term tramline, and yesterday, I had what I was hoping for an overshoot above and then a quick retreat back down underneath:

(Click on the image above for a larger version)
Overshoots are usually a signal that the short-term trend has changed, especially after a trend has been going for some time, as this has. I have shown many examples in the past in various markets.
Yesterday could have been the top
Another feature of yesterday's trading is that it was a daily key reversal, which is a day in which a new high is made, and then the market sells off to close below the previous day's close.
Now, this is not a super-reliable indicator of a trend-change. But if by Friday the market can close below the previous week's close, then this weekly change would be a much more reliable trend-change signal.
The level to watch for is 13,100 only 90 pips away as I write.
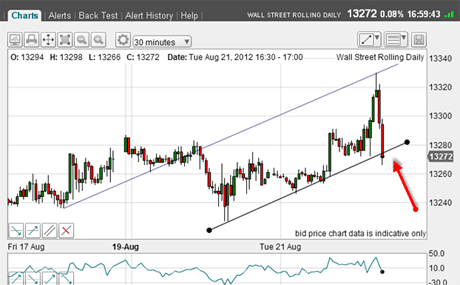
I was able to enter short-sale orders yesterday based on this 30-minute chart, which I took yesterday:

(Click on the image above for a larger version)
These tramlines are impressive, with fabulous prior pivot points (PPP) on the upper line.
The lower tramline break was my short entry, with protective stop just above the 13,330 high.
Now, if the market can break the 13,100 level this week, I may be looking to add to positions, since that would help confirm yesterday's high is the major top I have been waiting for seemingly forever!
A small homework exercise
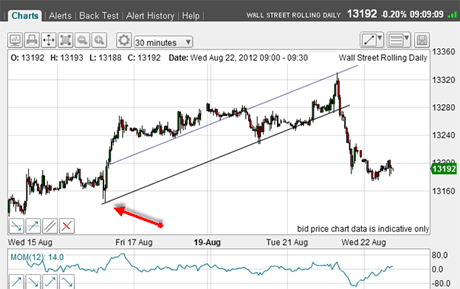
Here is the same chart updated to current market:

(Click on the image above for a larger version)
My lower tramline gratifyingly passes through the previous significant low (red arrow), giving me added confidence in them.
Currently, the market is pausing in the downtrend and right at a significant tramline.
Exercise: Can you work out where this significant tramline comes from? It is related to the existing lines.
So, I have a nice trade on my hands and I will be moving my protective stop to break-even for a no-risk trade. Any rallies should be kept under the 13,250 area (the 50% retrace of the move down). That should be a great place to add to my positions.
If you're a new reader, or need a reminder about some of the methods I refer to in my trades, then do have a look at my introductory videos:
The essentials of tramline trading
An introduction to Elliott wave theory
Advanced trading with Elliott waves
Don't miss my next trading insight. To receive all my spread betting blog posts by email, as soon as I've written them, just sign up here . If you have any queries regarding MoneyWeek Trader, please contact us here.
Get the latest financial news, insights and expert analysis from our award-winning MoneyWeek team, to help you understand what really matters when it comes to your finances.
John is is a British-born lapsed PhD physicist, who previously worked for Nasa on the Mars exploration team. He is a former commodity trading advisor with the US Commodities Futures Trading Commission, and worked in a boutique futures house in California in the 1980s.
He was a partner in one of the first futures newsletter advisory services, based in Washington DC, specialising in pork bellies and currencies. John is primarily a chart-reading trader, having cut his trading teeth in the days before PCs.
As well as his work in the financial world, he has launched, run and sold several 'real' businesses producing 'real' products.
-
 ISA fund and trust picks for every type of investor – which could work for you?
Whether you’re an ISA investor seeking reliable returns, looking to add a bit more risk to your portfolio or are new to investing, MoneyWeek asked the experts for funds and investment trusts you could consider in 2026
-
 The most popular fund sectors of 2025 as investor outflows continue
It was another difficult year for fund inflows but there are signs that investors are returning to the financial markets