Well the Aussie is currently tracing out some great tramlines some of the best I've seen lately.
So let's stick with its story today.
I'm pretty sure I'll move on next week there are some interesting developments in my main markets that I want to cover. So we'll catch up with what's happening in the Dow, the euro or gold early next week.
Try 6 free issues of MoneyWeek today
Get unparalleled financial insight, analysis and expert opinion you can profit from.

Sign up to Money Morning
Don't miss the latest investment and personal finances news, market analysis, plus money-saving tips with our free twice-daily newsletter
Don't miss the latest investment and personal finances news, market analysis, plus money-saving tips with our free twice-daily newsletter
Also today, I thought I'd briefly discuss the very thorny issue of where to place protective stops. There have been a few comments lately. So I'll let you know my thoughts.
The Aussie keeps on moving
First, back to the Aussie. On Wednesday, this was the state of play:
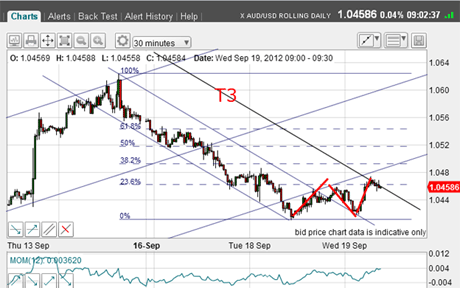
(Click on the chart for a larger version)
The market had bounced off the low in an A-B-C right to the Fibonacci 23% retrace level. I thought that there was probably another leg up in a larger A-B-C, since it seemed to me that the rally was too short in time. If not, I was willing to forego a short trade there.
Later on Wednesday, my hunch was vindicated and the market moved up above my third tramline, T3:
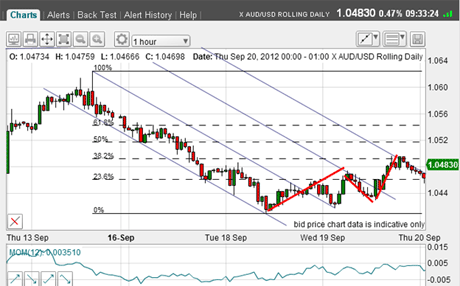
(Click on the chart for a larger version)
In fact, the rally reached my fourth tramline right at the Fibonacci 38% retrace. That was the place to enter a short sale.
So this morning, where are we?
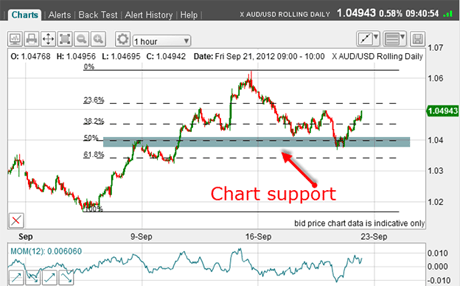
Market turns lower at the Fib 38%
The market retreated nicely from the Fibonacci 38% level, so we are on the right track, so far.
Because the Aussie is not in a clear long-term trend, it is good trading practice to look for likely downside targets and expect a reversal at some point.
In other words, a 'take the money and run' policy would be appropriate here after all, that is what bagged me the 350-pip profit last Friday.
(Click on the chart for a larger version)
This is the chart showing the rally leg and the decline off last Friday's high. I have applied the Fibonacci tool to the rally and sure enough, after Wednesday, the market dipped below Tuesday's low and hit (and overshot) the Fibonacci 50% level.
At that level, there also lurked solid chart support (blue bar) from the7 September high.
Not only that, but the form of the decline has a distinct A-B-Cshape to it.
There we are: three excellent reasons to take profits and exit the trade.
Looking for the next tramline
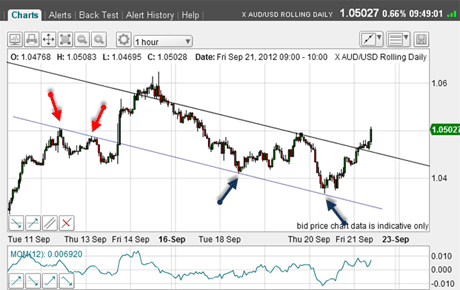
This morning, the market has rallied and has overcome Wednesday's high in the last few moments. Can I now find a new tramline set that is operating? I believe I can:
(Click on the chart for a larger version)
My lower tramline has the two excellent prior pivot points(PPPs - red arrows) and the two terrific touch-points (blue arrows), while my upper tramline is set across the Wednesday high.
If you had drawn in my lower tramline yesterday, that would give you an additional reason to cover your short trade.
Now, the market appears very bullish here and we may see an imminent challenge to the Friday high in the 1.06 area.
If you've been following theseposts for a while, I'm sure you can now draw in your own third upper tramline as possible first target. Why not give that a go?
What is your stop placement policy?
As you know, I advocate using stops on all open positions. No exceptions.
The big question for all traders is shall I use close stops to limit my losses, or shall I use wider stops to give my trades more room to work?
This is the eternal dilemma for everyone even for experienced traders. There is probably nothing more annoying than to see your stop hit which realises a loss, and then the market turns around and goes in your direction.
This is a great test for any trader and will reveal your own inner character to put it mildly.
Right away, I must emphasise there are no easy answers. Most of us will go through a phase where many of your stops are ticked off and another phase where you can do no wrong with stop placement.
Finally, if you are going through a period where your stops are being hit too often, just step back, reduce or stop your trading and examine whether using a different strategy would help.
I know someone who is a trend-follower and he uses very wide stops (several hundred pips in the euro). If that appeals to you, then I suggest you take a look.But for swing trading, that policy would be disastrous.
There are many styles of trading (mine is just one) and many stop loss policies. It is horses for courses. But if you are a relative beginning trader, I suggest you stick to my 3% rule and use small bets at first.
Staying out of trouble is the name of the game at all times!
If you're a new reader, or need a reminder about some of the methods I refer to in my trades, then do have a look at my introductory videos:
The essentials of tramline trading
An introduction to Elliott wave theory
Advanced trading with Elliott waves
Don't miss my next trading insight. To receive all my spread betting blog posts by email, as soon as I've written them, just sign up here . If you have any queries regarding MoneyWeek Trader, please contact us here.