More great trading lessons from the Aussie dollar
The Australian dollar is throwing up some textbook examples of how to use tramlines in your trading, says John C Burford. So, where to next for the Aussie?
Get the latest financial news, insights and expert analysis from our award-winning MoneyWeek team, to help you understand what really matters when it comes to your finances.
You are now subscribed
Your newsletter sign-up was successful
Want to add more newsletters?

Twice daily
MoneyWeek
Get the latest financial news, insights and expert analysis from our award-winning MoneyWeek team, to help you understand what really matters when it comes to your finances.

Four times a week
Look After My Bills
Sign up to our free money-saving newsletter, filled with the latest news and expert advice to help you find the best tips and deals for managing your bills. Start saving today!
I must appear like a dog with a bone I can't leave the Aussie dollar alone!
It's not only because I have a hankering for some warm sun. It's more that the Aussie chart right now is throwing up some wonderful examples of how you can use my tramline methods, not just in my usual favourites the Dow/S&P, euro and gold but in a wide variety of other markets.
In today'spost we'll see that the AUS/USD is currently doing just that in spades. I know that some readers already trade the Aussie and can see how well these methods apply to it. Let me know at the end if you too are seeing these opportunities on your charts.
MoneyWeek
Subscribe to MoneyWeek today and get your first six magazine issues absolutely FREE

Sign up to Money Morning
Don't miss the latest investment and personal finances news, market analysis, plus money-saving tips with our free twice-daily newsletter
Don't miss the latest investment and personal finances news, market analysis, plus money-saving tips with our free twice-daily newsletter
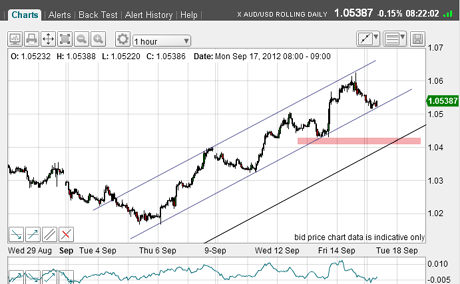
On Monday, I had just taken over 350 pips profit on a long trade and was looking for a pullback. This was the short-term chart then:

(Click on image above for larger version)
Recall that I had drawn in my third (lowest) tramline equidistant from the centre line. I was very confident that I could rely on my upper tramline, as it had a great prior pivot point (PPP) and then two excellent touch-points, the final one being my profit-taking area.
Aussie breaks down towards my lower tramline
I then suggested that the market could break and fall to test the lowest tramline and to test the area of support at Thursday's low (pink bar).
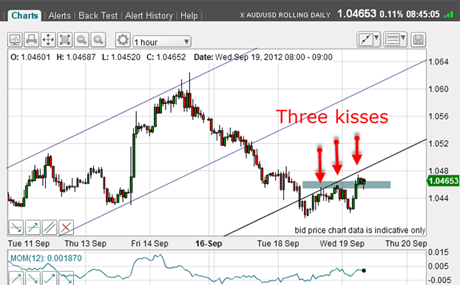
And yesterday, I got my break and the run down to the third tramline and into the pink zone.
There was a short trade offered if taken at Friday's high, of course. But I was interested in what would be the outcome of this pink zone test.
Here is the above chart in close-up and updated to this morning:

(Click on image above for larger version)
See how yesterday, the market edged below my third tramline and then rallied to kiss the underside of the tramline twice, and is currently in a third embrace.
Is this a great place to enter a short trade?
Normally, I would say yes. But look at the blue bar I've added marking the tip of yesterday's rally. The market has fallen hard from Friday's high and I would normally expect a larger (and longer in time) bounce. This upside break of the blue bar is normally a sign that the rally has legs. So the jury is out on this.
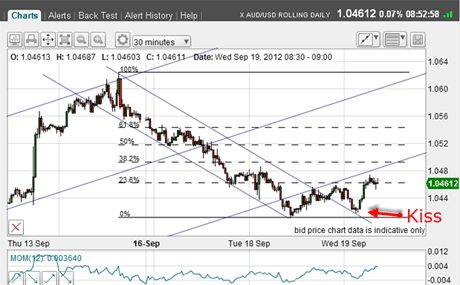
So now let's look at the down move from Friday's high in detail:

(Click on the chart for a larger version)
I can draw a great lower down-sloping tramline with several touch-points and my upper line passes across Friday's high.
Using Fibonacci for possible turning points
Yesterday, the market rallied above the upper line and then came back down to kiss the line before staging a scalded cat bounce and towards the Fibonacci 23% retrace of the move down.
Note that I was quick to apply my Fibonacci tool when I suspected yesterday's low would probably hold and give me the lower pivot point.
Currently, the market is trading along this Fibonacci level as it tries to decide where to go next.
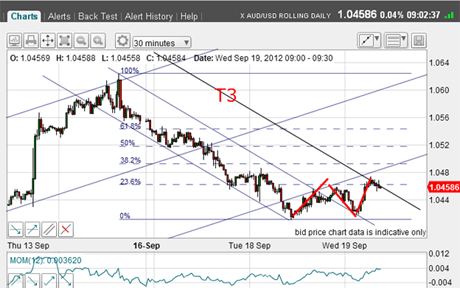
But now I can draw in another third tramline, T3:

(Clickon the chart for a larger version)
The market has rallied right to that line and in a possible A-B-C pattern.
Trader tip: Remember, an A-B-C rally in a bear market is normally a giveaway that the down trend has not yet finished.
At first, the case seems overwhelming for a short trade in this region with a close stop, say above the Fibonacci 38% level.
But I have my eye on that blue bar! I have a sneaking feeling that we will see a larger bounce perhaps up to the 50% retrace in the 1.0520 area.
And the A-B-C I have drawn in may be part of a larger A-B-C that is always possible.
So for now, I will sit and watch. If I miss this trade, no matter.
What you will find is that in trading, you do not need to be in the market all of the time. In fact, after taking a good profit, it can be good for your stress levels to be a spectator.
I'll be back on Friday hopefully with another market, as I don't want to overstay my welcome in the Aussie!
I hope you found today's analysis useful. Let me know your thoughts on this and any other observations below.
If you're a new reader, or need a reminder about some of the methods I refer to in my trades, then do have a look at my introductory videos:
The essentials of tramline trading
An introduction to Elliott wave theory
Advanced trading with Elliott waves
Don't miss my next trading insight. To receive all my spread betting blog posts by email, as soon as I've written them, just sign up here . If you have any queries regarding MoneyWeek Trader, please contact us here.
Get the latest financial news, insights and expert analysis from our award-winning MoneyWeek team, to help you understand what really matters when it comes to your finances.
John is is a British-born lapsed PhD physicist, who previously worked for Nasa on the Mars exploration team. He is a former commodity trading advisor with the US Commodities Futures Trading Commission, and worked in a boutique futures house in California in the 1980s.
He was a partner in one of the first futures newsletter advisory services, based in Washington DC, specialising in pork bellies and currencies. John is primarily a chart-reading trader, having cut his trading teeth in the days before PCs.
As well as his work in the financial world, he has launched, run and sold several 'real' businesses producing 'real' products.
-
 Can mining stocks deliver golden gains?
With gold and silver prices having outperformed the stock markets last year, mining stocks can be an effective, if volatile, means of gaining exposure
-
 8 ways the ‘sandwich generation’ can protect wealth
People squeezed between caring for ageing parents and adult children or younger grandchildren – known as the ‘sandwich generation’ – are at risk of neglecting their own financial planning. Here’s how to protect yourself and your loved ones’ wealth.