This simple method just made me 350 points of profit
John C Burford's Australian dollar trade is throwing up some great tramlines, pinpointing a textbook low-risk trade.
Get the latest financial news, insights and expert analysis from our award-winning MoneyWeek team, to help you understand what really matters when it comes to your finances.
You are now subscribed
Your newsletter sign-up was successful
Want to add more newsletters?

Twice daily
MoneyWeek
Get the latest financial news, insights and expert analysis from our award-winning MoneyWeek team, to help you understand what really matters when it comes to your finances.

Four times a week
Look After My Bills
Sign up to our free money-saving newsletter, filled with the latest news and expert advice to help you find the best tips and deals for managing your bills. Start saving today!
This morning let's check in on my Aussie dollar trade, as it's throwing up some great tramlines to pinpoint a textbook low-risk trade.
Remember, this isn't a trade recommendation that's not what MoneyWeek Trader is about. But I hope that this example can help you in your own trading performance. It shows you how I use tramlines to enter and exit trades.
This is one of the great benefits of using my tramline method: it can allow you to enter a market at low risk and also give target exits. What more can a trader need?
MoneyWeek
Subscribe to MoneyWeek today and get your first six magazine issues absolutely FREE

Sign up to Money Morning
Don't miss the latest investment and personal finances news, market analysis, plus money-saving tips with our free twice-daily newsletter
Don't miss the latest investment and personal finances news, market analysis, plus money-saving tips with our free twice-daily newsletter
Trading made simple
There's just no use beating yourself up trying to understand the 'fundamentals', such as analysing Australian exports/imports, the debt/GDP ratios, interest rate differentials, and so on.
All you need is a chart with a tool to enable you to draw straight parallel lines. What could be simpler? That's what I really want you to discover as you read MoneyWeek Trader.
The fact is, many traders tie themselves up in knots trying to get to grips with very complex inputs and suffer from information overload. Nothing could be more damaging and confusing to your performance.
Of course, there are many convincing writers out there who can lay out a very compelling case for why a market will go a certain way.
But you'll also find others, equally convincing, that can show you why the market will do the opposite! That's why markets exist, by the way.
And this is where trader bias creeps in. If you've been to one of my workshops, you'll know all about this crucial aspect. I've written about it, too. Let me remind you
The dangers of trader bias
Those traders already predisposed to a certain view will gravitate to those gurus who are in agreement, and reject those who are not.
All of us suffer from this kind of bias. But the key to success is to recognise your own bias and correct for it.
For instance, I have been long-term bearish on gold for some time and I have been wrong in recent weeks on the medium term. My bias has got in the way of taking a long trade, despite the fact that some of my charts were indicating this was the correct strategy.
That is why I've decided to stop trading gold for now.
But as I have shown in previous articles, I did spot a long trade in the Aussie which I considered a proxy for a long gold position. So all was not lost.
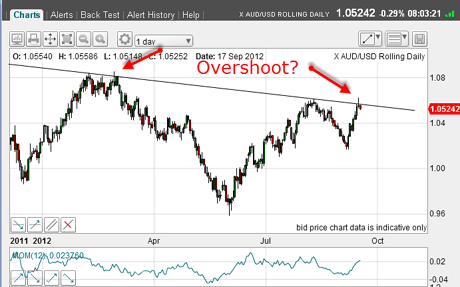
OK, here is the updated daily chart showing my long-term downtrend line drawn off the August 2011 high:

(Click on the chart for a larger version)
The market caught a bid last week and rallied towards my downtrend line along with most other currencies vs the US dollar and has created a potential 'overshoot', similar to the one on 29 February.
Remember, these overshoots indicate very strong resistance as the market attempts to move above the line of resistance. But after buy-stops are taken out, the buying dries up and the market falls under its own weight.
That's why in last Wednesday's article, I was on high alert to take a profit on my long trade.
How tramlines helped me pick my exit
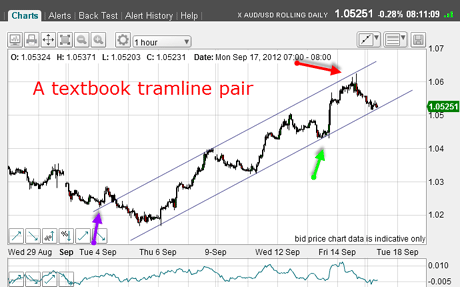
To give me a more precise exit, I needed to see what was going on in the hourly chart:

(Click on the chart for a larger version)
And here you can see my terrific tramline pair, which I was able to draw last week.
First, I drew in my lower tramline, as that gave me three good touch-points up until Thursday's low (green arrow).
For my parallel upper tramline, I had a good prior pivot point (PPP) - the purple arrow - and the high of 7 September as a touch-point.
I knew I could rely on these tramlines to give me a good exit and on Friday, when the market moved up to touch the upper tramline (red arrow), I pulled the trigger.
That was a very nice 350-pip plus profit. Not bad for a week.
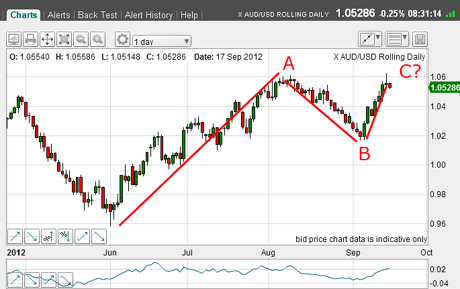
Also recall that my first thought was the rally was going to be a small A-B-C. Now I know that was wrong as labelled, but look at this on the daily:

(Click on the chart for a larger version)
This could certainly qualify as a larger-scale A-B-C, with Friday's high just squeezing past the A wave high and with a potential negative momentum divergence!
OK, I had my potential overshoot at my upper tramline. But could I say the rally was over? Remember, this is only a potential overshoot.
This morning, the market is trading back down on the lower tramline, and so a logical trade is to go long again with a close stop.
Adding another tramline to build my roadmap
It is entirely possible for the market to rally and move convincingly above my long-term trendline, thus wiping out the 'overshoot'.
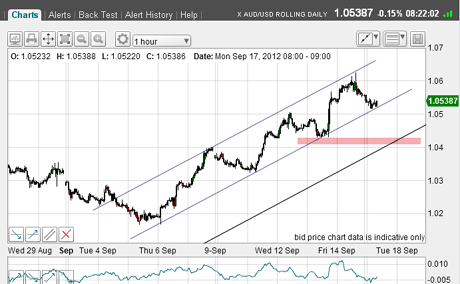
But if the market breaks below the lower tramline now my central tramline in the chart below the next support surrounds the area just above 1.04 (pink bar):

(Click on the chart for a larger version)
This is in the same area as my third tramline.
So now I have a roadmap. That is comforting.
Listen to the news but trade off the charts
Going back to my earlier point I am not immune to the current political shenanigans primarily in the eurozone and with the US Fed. After all, many market participants apparently base their decisions on these developments. That is why I need to keep abreast of these events.
But, as I hope I am showing you in these articles, it is the charts and my tramlines that is the more reliable method for extracting profits. The actions of the politicos are mirrored in the charts.
Many people subscribe to all sorts of conspiracy theories from the Fed manipulating interest rates to Morgan manipulating precious metals to Goldman Sachs owning the world's financial system.
Some of them may even be true!
But even if true, the market will still give us reliable trading signals through the methods I have developed. I sincerely hope you can use them profitably.
Any thoughts on today's article or anything you'd like to share about your trading generally do please leave your thoughts below.
If you're a new reader, or need a reminder about some of the methods I refer to in my trades, then do have a look at my introductory videos:
The essentials of tramline trading
An introduction to Elliott wave theory
Advanced trading with Elliott waves
Don't miss my next trading insight. To receive all my spread betting blog posts by email, as soon as I've written them, just sign up here . If you have any queries regarding MoneyWeek Trader, please contact us here.
Get the latest financial news, insights and expert analysis from our award-winning MoneyWeek team, to help you understand what really matters when it comes to your finances.
John is is a British-born lapsed PhD physicist, who previously worked for Nasa on the Mars exploration team. He is a former commodity trading advisor with the US Commodities Futures Trading Commission, and worked in a boutique futures house in California in the 1980s.
He was a partner in one of the first futures newsletter advisory services, based in Washington DC, specialising in pork bellies and currencies. John is primarily a chart-reading trader, having cut his trading teeth in the days before PCs.
As well as his work in the financial world, he has launched, run and sold several 'real' businesses producing 'real' products.
-
 Average UK house price reaches £300,000 for first time, Halifax says
While the average house price has topped £300k, regional disparities still remain, Halifax finds.
-
 Barings Emerging Europe trust bounces back from Russia woes
Barings Emerging Europe trust has added the Middle East and Africa to its mandate, delivering a strong recovery, says Max King