A great tramline trade in the Aussie dollar
Traders are falling over themselves in the rush to short the Australian dollar, says John C Burford. But does the Aussie have a nasty surprise in store?
Get the latest financial news, insights and expert analysis from our award-winning MoneyWeek team, to help you understand what really matters when it comes to your finances.
You are now subscribed
Your newsletter sign-up was successful
Want to add more newsletters?

Twice daily
MoneyWeek
Get the latest financial news, insights and expert analysis from our award-winning MoneyWeek team, to help you understand what really matters when it comes to your finances.

Four times a week
Look After My Bills
Sign up to our free money-saving newsletter, filled with the latest news and expert advice to help you find the best tips and deals for managing your bills. Start saving today!
On Friday, I wrote of my chagrin at having missed the August gold rally. But this has been tempered by a super tramline trade in the Aussie dollar.
The Aussie is heavily influenced by movements in commodity markets, since Australia is a major world producer of raw materials. And with growth in China its biggest customer visibly slowing, the feeling in the currency markets has been bearish the Aussie. The common belief is that demand for many commodities will continue to slow, and the pressure on the currency will intensify.
In fact, the bearish chorus on China has intensified in recent weeks as the Shanghai stock index plumbs new yearly lows.The received wisdom is that China has hit the skids and the long-forecast hard landing' is within sight.
MoneyWeek
Subscribe to MoneyWeek today and get your first six magazine issues absolutely FREE

Sign up to Money Morning
Don't miss the latest investment and personal finances news, market analysis, plus money-saving tips with our free twice-daily newsletter
Don't miss the latest investment and personal finances news, market analysis, plus money-saving tips with our free twice-daily newsletter
As for the Aussie, this has become one of those obviously correct forecasts; similar to last year's obvious' view that gold can only go up in the face of central bank policies of gigantic money printing leading to hyper-inflation.
As we should know by now, when a particular view becomes widespread as this has that is when I sniff a trading opportunity in the opposite direction.
And so it is proving with the Aussie.
Why the bears are wrong
Veteran trader Joe Granville has a famous maxim: "When something appears obvious to the majority, it is obviously wrong".
That is why I have been tracking the Aussie lately and it has proved rewarding.
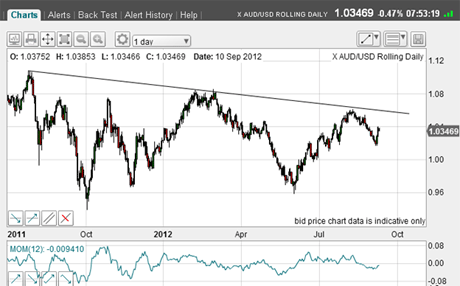
Here is the daily chart for the past year or so:

(Click on the chart for a larger version)
There have been several very large swings, but no clear long-term trend.This is ideal for a swing trader maybe I should cover this market a little more often.
With this summer's recovery in many commodities from grains to gold the Aussie rallied from its 4 June low to reach the downtrend line drawn off the previous tops.
That was a great place to look for a short trade.
But with the bearish noises coming from the growing army of China doomsters, the Aussie then fell quite sharply to last week's sub-1.02 low.
It appeared curtains for the currency.
But there was something wrong with this picture. The problem was that gold was rallying sharply.So why was the Aussie so weak?Something had to give either gold and other commodities would fall, or the Aussie was mispriced and would rise.
And last week's action took the market to the significant Fibonacci 38% retrace of the summer rally!This is normally where support emerges.
Time to look for a long trade.
Looking for a good entry
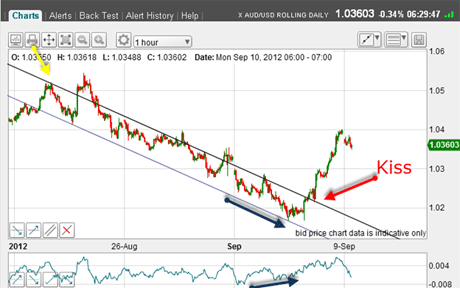
Here is the short-term chart showing my tramlines.I could draw the lower one first, as there were several good touch-points. The upper one I drew in to catch the high marked by the yellow arrow:

(Click on the chart for a larger version)
Clearly, the upper one is not perfect, but I considered it good enough for a working hypothesis.
The crucial point for me was the forming positive momentum divergence on Wednesday (blue arrows).The selling was drying up.
Then on Thursday, the market moved sharply above my tramline, dipped back to kiss it, and then zoomed upwards in an impulsive fashion.
There were two entry points the first tramline break and then at the kiss. My protective stop was just below the low.
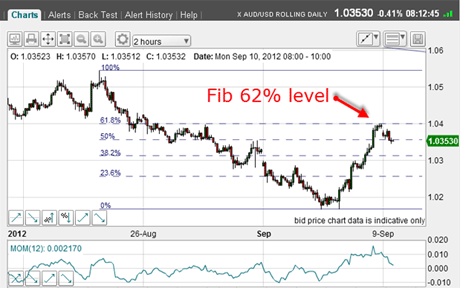
So I had a tiger by the tail and needed to determine a possible target.That is where the Fibonacci tool comes into its own:

(Click on the chart for a larger version)
These are the Fibonacci retrace levels drawn off the most recent August major high and last week's low.
The rally had carried to the exact 62% level late on Friday.That was a great place for a target where profits could be taken if trading very short-term.
So, is that it for the bear market rally, or is there more to come?This is a crucial question if trading against the long-term trend.
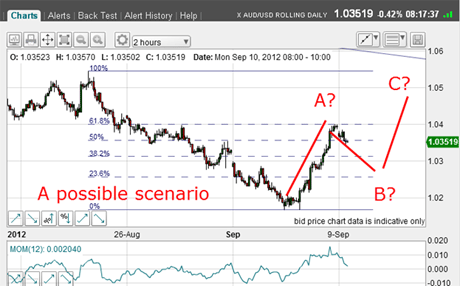
Because many counter-trend rallies in a bear market come as A-B-C formations, it is logical to expect this rally to bear this pattern.
So this is a possible scenario:

(Click on thechart for a larger version)
But beware this is not necessarily to scale! The B wave could be shallow, and the C wave could top out lower than that shown. The market, as always, will decide. That is why you need to watch the market closely when in this position.
But I am confident I have the A wave top labelled correctly, as momentum there was very over-bought.
But at least, this little bit of Elliott wave theory gives me a possible roadmap for the near-term action.This could be valuable information.
Also, if this is proved to be correct, I would expect the B wave to also sport an A-B-C form.
So my Aussie trade is giving me some relief from the kicks I gave my legs last week.
I shall follow up on this market as I believe it will continue to offer more great examples of how to use my methods in extracting profits from the markets.
If you're a new reader, or need a reminder about some of the methods I refer to in my trades, then do have a look at my introductory videos:
The essentials of tramline trading
An introduction to Elliott wave theory
Advanced trading with Elliott waves
Don't miss my next trading insight. To receive all my spread betting blog posts by email, as soon as I've written them, just sign up here . If you have any queries regarding MoneyWeek Trader, please contact us here.
Get the latest financial news, insights and expert analysis from our award-winning MoneyWeek team, to help you understand what really matters when it comes to your finances.
John is is a British-born lapsed PhD physicist, who previously worked for Nasa on the Mars exploration team. He is a former commodity trading advisor with the US Commodities Futures Trading Commission, and worked in a boutique futures house in California in the 1980s.
He was a partner in one of the first futures newsletter advisory services, based in Washington DC, specialising in pork bellies and currencies. John is primarily a chart-reading trader, having cut his trading teeth in the days before PCs.
As well as his work in the financial world, he has launched, run and sold several 'real' businesses producing 'real' products.
-
 Can mining stocks deliver golden gains?
With gold and silver prices having outperformed the stock markets last year, mining stocks can be an effective, if volatile, means of gaining exposure
-
 8 ways the ‘sandwich generation’ can protect wealth
People squeezed between caring for ageing parents and adult children or younger grandchildren – known as the ‘sandwich generation’ – are at risk of neglecting their own financial planning. Here’s how to protect yourself and your loved ones’ wealth.