Before I cover gold, I would like to discuss a very important factor in trading the financial markets. It's one which many traders pay absolutely no attention to, but can cost them dear if it is not addressed.
I am talking about trader biases. Don't worry we all have them. The key to operating effectively though is to recognise your own biases and whether yours are so extreme that they blind you to taking wrong trades time after time.
Psychologists have investigated the human tendency towards bias for a long time. We're predictably biased in a number of ways.
Try 6 free issues of MoneyWeek today
Get unparalleled financial insight, analysis and expert opinion you can profit from.

Sign up to Money Morning
Don't miss the latest investment and personal finances news, market analysis, plus money-saving tips with our free twice-daily newsletter
Don't miss the latest investment and personal finances news, market analysis, plus money-saving tips with our free twice-daily newsletter
A typical bias that affects traders is information gluttony': The more I read and gather information on the economy (or the particular market we are studying), the more confident I will be in my forecasts and I will be a better trader.

This seems like common sense, does it not? Most people believe this. But in the markets, this is a dangerous belief!
So much so that Daniel Boorstin said: "The general obstacle to discovery is not ignorance it is the illusion of knowledge".
Some time ago, a famous experiment was conducted using experts in their field - eight experienced bookmakers were shown a list of 88 variables thataffect the performance of racehorses.
Each bookie was asked to rank each piece of information by importance.
Then, the bookies were given this data for 40 past races (with results hidden) and asked to rank the top five horses in each race.
Each bookie was given this data in increments of the five, ten, twenty, and forty variables the bookie had selected as the most important.
Thus, each bookie predicted the winner four times in each race. For each prediction, the bookie was asked to state the degree of confidence in each prediction.
The results were surprising! They showed that instead of accuracy and confidence increasing over time, while confidence increased markedly, the accuracy remained flat.
With just five pieces of information, accuracy and confidence were closely related. But with forty pieces, accuracy was still only around 15%, while confidence soared to double the initial reading!
The implication for us is clear more information does not automatically translate into better forecasts. That is why I like to keep things as simple as I can and why I stick to my trading methods, which are the essence of simplicity.
Gold is the asset investors love to love
OK, let's turn to gold. Surely, I am not alone in noticing a barrage of bullish articles on the yellow metal? The Telegraph, in particular, has been running this article repeatedly: "Gold to hit $1,800 by year-end predicts analyst".
This forecast is pretty tame compared with others I have read.
Gold may or may not hit this target, but one thing is certain that when gold rallies, bullish articles come out of the woodwork. Where were they in May, when gold was trading $160 lower?
Meanwhile, since I last covered gold on 29 August, the market has caught a bid and has broken above my upper tramline:
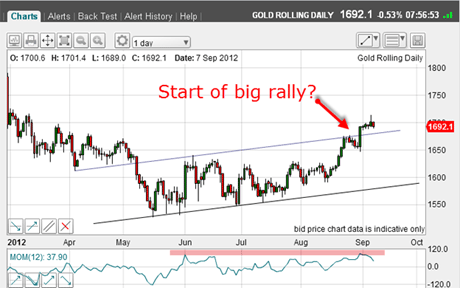
(Click on the image above for a larger version)
So, is this the start of a big rally towards the $1,800 area that has been widely touted as a year-end target? If so, I had better mend my ways and start trading from the long side.
But there are a few reasons why I am reluctant to switch camps just yet. In the above chart, note the momentum reading is at levels previously identified with tops. The market is approaching being overbought. This is not necessarily fatal to the rally, since high readings can exist for a long time in a strong move, but it is flashing a yellow.
Incidentally, my short trade described last time resulted in a loss. Here is the chart:
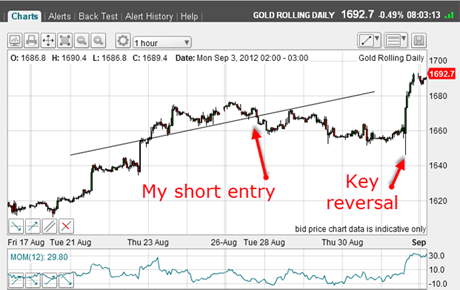
(Click on the image above for a larger version)
For a while, my trade was looking good as the market dropped to the sub-$1,650 level. But then there was huge buying which resulted in new highs for the move.
If I was trading on the very short term, I had an opportunity to take a profit before the key reversal kicked in.
My loss was well within the 3% rule limit, so that will go down as one of my losers.
A great mental test
Now, the market has been powering up and I have been caught wrong-footed. This is always a great mental test for a trader. I have found that the best policy in this situation is to do nothing. It is all too easy to panic into a wrong move at the wrong time. You want to recoup your loss quickly, don't you?
In gold especially, I have found it normally a poor policy to chase the market. Mostly, you will be getting in just as the market begins a sharp counter-move. You may find yourself at the wrong side of one of the many spikes!
The other difficulty is this: if you are fortunate and the market continues going your way, where do you take profits? Psychologically, you are so relieved to be clawing back some of your losses that you are tempted to stay at the party too long your bias here is over-optimism.
I confess I suffer from this bias, and so I must always check myself when in this situation.
Gold approaches the danger zone'
Back to gold here is another reason why I doubt the longevity of this rally:
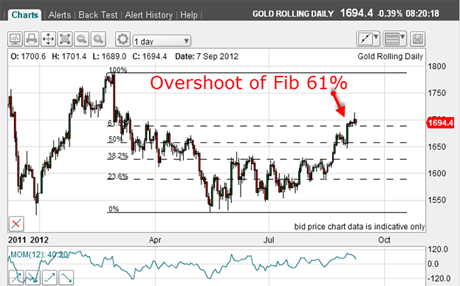
(Click on the image above for a larger version)
The rally has overshot the Fibonacci 62% level of the move down off the 29 February high to the 16 May low. This could be significant.
Here is the action in close-up:
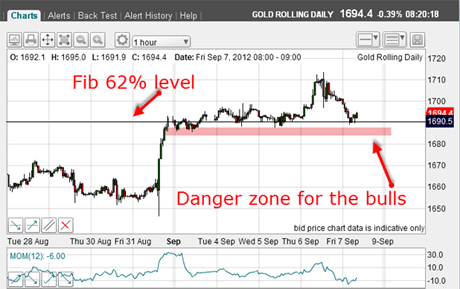
(Click on the image above for a larger version)
The market has tried to move above the 62% level, but has been knocked back down to it as I write.
The pink bar is my idea of the danger zone for the bulls. A move below this zone should herald a deeper retreat and a possible short entry.
I am still treating the May-September rally as a bear market rally so far. Am I exhibiting an irrational bias?
Incidentally, I spotted a great tramline trade in a related market the AUS/USD, which has at least partially offset my gold loss. I may cover this off-piste market next week I know many traders are interested in this market.
If you're a new reader, or need a reminder about some of the methods I refer to in my trades, then do have a look at my introductory videos:
The essentials of tramline trading
An introduction to Elliott wave theory
Advanced trading with Elliott waves
Don't miss my next trading insight. To receive all my spread betting blog posts by email, as soon as I've written them, just sign up here . If you have any queries regarding MoneyWeek Trader, please contact us here.