Why gold is a great market for tramline trading
The gold market is on virtually every spread-better's radar. Here, John C Burford explains the benefits of 'tramline' trading' when spread betting on gold.
Get the latest financial news, insights and expert analysis from our award-winning MoneyWeek team, to help you understand what really matters when it comes to your finances.
You are now subscribed
Your newsletter sign-up was successful
Want to add more newsletters?

Twice daily
MoneyWeek
Get the latest financial news, insights and expert analysis from our award-winning MoneyWeek team, to help you understand what really matters when it comes to your finances.

Four times a week
Look After My Bills
Sign up to our free money-saving newsletter, filled with the latest news and expert advice to help you find the best tips and deals for managing your bills. Start saving today!
In my most recent posts, I've been giving examples of how you can trade in the crude oil market using my tramline trading approach. This method, along with the Elliott wave/Fibonacci principles, allows for precise forecasts of market direction and turning points with high reliability. Very few trading methods can give you this.
Now it's time to turn our attention to gold. This market is on virtually every spread-better's radar. And we all know why. Claims that we're heading for the demise of 'fiat' currencies are all over the blogosphere. Historically, gold has been the only 'real' money, which is why you should be bullish. It all seems so obvious.
I read many comments on articles on gold in a few financial websites, many are quite violently bullish on gold (and to a slightly lesser extent, silver). But one very interesting observation is that I have yet to read a comment or article that's bearish on gold. As a trader (who should never become 'married' to an economic view, unless it's supported by the market), this is noteworthy.
MoneyWeek
Subscribe to MoneyWeek today and get your first six magazine issues absolutely FREE

Sign up to Money Morning
Don't miss the latest investment and personal finances news, market analysis, plus money-saving tips with our free twice-daily newsletter
Don't miss the latest investment and personal finances news, market analysis, plus money-saving tips with our free twice-daily newsletter
So what does the market tell us about gold?
But let's see what the market can tell us using my tramline methods. Recall that a tramline is simply a line of support and resistance that separates phases of trading. One phase is where trading is below the line (resistance) and the other phase is where trading above it (support).
If I can find parallel lines which connect many of other major highs and lows, they will create a valid tramline. And if I can find yet more parallel lines that are equidistant from each other, and that intersect even more highs and lows, this will create another tramline.
As I showed in the crude oil examples, this process can be repeated ad infinitum until it stops working.
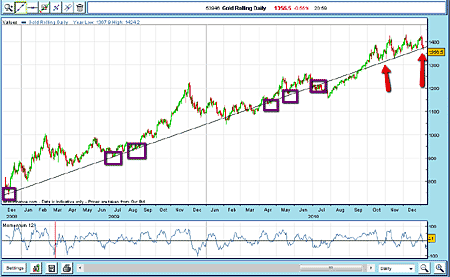
So here is the daily chart for gold, going back just over two years:
(Click on the chart for a larger version)
I have made my 'best fit' of a potential centre tramline using many of the important highs and lows made over this period. This is the chart up to January. I have marked important highs and lows with purple boxes, and I have highlighted the late 2010 trading with red arrows. I shall look at this area in more detail later.
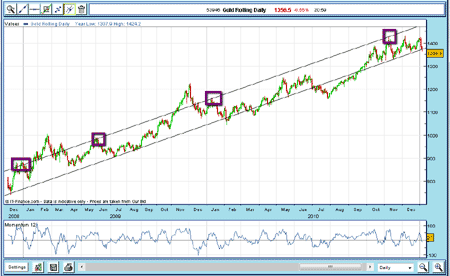
Now let's see if I can make a case for a second tramline. Using my parallel line tool on my spread-betting platform, I find a good candidate above my original line:
(Click on the chart for a larger version)
Again, I have marked important highs with purple boxes. So now, I have a good working basis for my tramline pair.
Using multiple tramlines
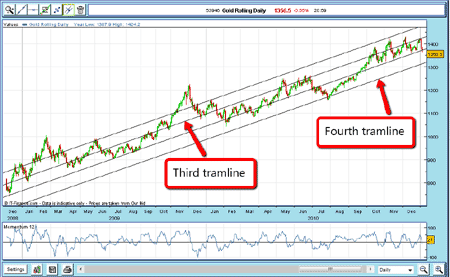
Now this is where it gets interesting. I can draw a third tramline mid-way between this pair and it passes through (or close to) other important highs and lows. But that is not all, if I draw a fourth line equidistant beneath my original lower tramline, this is what we get:
(Click on the chart for a larger version)
There is only one point close to this fourth line, and it overshoots it by about $12. I will get back to this line later, as it could well figure in my forecast!
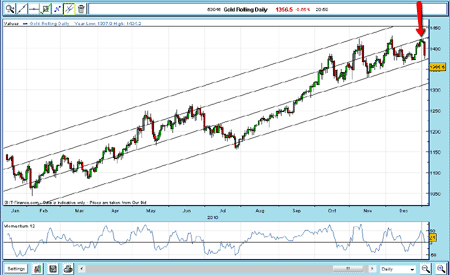
Trading in late 2010 was very volatile with wide swings up and down. This occurred after a huge and historic bull run, which really got going in 2005 from the $400 level. Here is a closer look at trading in 2010:
(Click on the chart for a larger version)
In December, the market was trading up from the original lower tramline to approach my new third tramline. It hit that line and immediately backed off (marked by red arrow). That gave me confidence my tramlines really are in the right place.
Also in the chart, note the "overshoot" of my fourth tramline in the July dip. I'll come back to that in a moment.
What's happening now?
Now let's fast forward to today, 11 February. My original lower tramline was breached in January and the market corrected even further to breach (again) my fourth tramline at the end of January. This month has seen a recovery from a very oversold position. Also, using our Elliott wave concepts, the January decline could be seen to be in only three waves. These are corrective waves. This indicates that the bull market is still intact, at least for now.
With a rebound off the 28 January low, I can now bring in my Fibonacci tool to give some potential turning points for this rally.
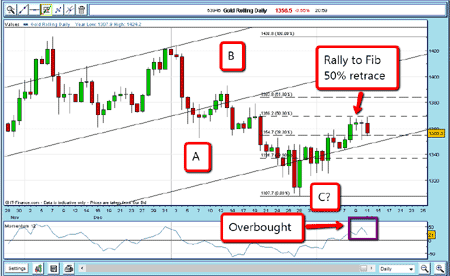
(Click on the chart for a larger version)
As can be seen, the rally was turned away at the exact Fibonacci 50% level. This was a great place to short, particularly in light of the overbought momentum reading as marked in purple on the chart above.
The market is currently moving down from that level, and so protective stops could be moved down to break-even, using my break-even rule. But with the market hovering around my fourth tramline, will it find support and have a go at my third tramline? Or will it break below my fourth tramline?
I shall continue this theme and the link with silver in my very next post. Do tune in.
NB: Don't miss my next bit of trading advice. To receive all my spread betting blog posts by email, as soon as I've written them, just sign up here .
Get the latest financial news, insights and expert analysis from our award-winning MoneyWeek team, to help you understand what really matters when it comes to your finances.
John is is a British-born lapsed PhD physicist, who previously worked for Nasa on the Mars exploration team. He is a former commodity trading advisor with the US Commodities Futures Trading Commission, and worked in a boutique futures house in California in the 1980s.
He was a partner in one of the first futures newsletter advisory services, based in Washington DC, specialising in pork bellies and currencies. John is primarily a chart-reading trader, having cut his trading teeth in the days before PCs.
As well as his work in the financial world, he has launched, run and sold several 'real' businesses producing 'real' products.
-
 Average UK house price reaches £300,000 for first time, Halifax says
While the average house price has topped £300k, regional disparities still remain, Halifax finds.
-
 Barings Emerging Europe trust bounces back from Russia woes
Barings Emerging Europe trust has added the Middle East and Africa to its mandate, delivering a strong recovery, says Max King