Finding low-risk, high-reward trades in the crude oil market
Many spread-betters and traders shy away from the crude oil market because of its 'spikiness'. But it is possible to make relatively low-risk/high gain trades, says John C Burford.
Get the latest financial news, insights and expert analysis from our award-winning MoneyWeek team, to help you understand what really matters when it comes to your finances.
You are now subscribed
Your newsletter sign-up was successful
Want to add more newsletters?

Twice daily
MoneyWeek
Get the latest financial news, insights and expert analysis from our award-winning MoneyWeek team, to help you understand what really matters when it comes to your finances.

Four times a week
Look After My Bills
Sign up to our free money-saving newsletter, filled with the latest news and expert advice to help you find the best tips and deals for managing your bills. Start saving today!
Recently, I have shown how, by using my simple tramline trading approach to recent market action in crude oil, it's possible to forecast turning points in even a difficult market like crude.
I know many spread-betters and traders shy away from trading this market because of its 'spikiness'. But when using my tramline methods, I believe it is possible to make relatively low-risk/high gain trades.
The key is to pick off the tops and bottoms of the spikes, rather than trade the break-outs. These can often snap back on you, taking out your stops. My tramline method can help identify these points.
MoneyWeek
Subscribe to MoneyWeek today and get your first six magazine issues absolutely FREE

Sign up to Money Morning
Don't miss the latest investment and personal finances news, market analysis, plus money-saving tips with our free twice-daily newsletter
Don't miss the latest investment and personal finances news, market analysis, plus money-saving tips with our free twice-daily newsletter
I'll continue with this market because it offers terrific evidence of how markets are structured and patterned. Of course, Mr Elliott discovered in the 1930s that markets have a well-defined structure. But because his observations were not 'mainstream', generated by academic economists (who have ruled the roost for decades, despite their monumental failures to forecast anything), they have been sidelined somewhat, left to those curious enough to dig behind the 'obvious'.
Back to the crude market
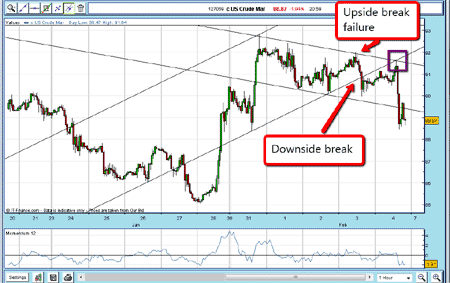
But I digress. Recall, I left off trading crude on 4 February (see chart below):

(Click on the chart for a larger version)
I have drawn two sets of tramlines one on the way up, and the other as the market came down from the 31 January peak. I noted that the peak on 4 February topped right at the confluence of the two major tramlines, and then started falling.
That was a significant clue that the trend was changing from up to down.
Then, later in the day, the market fell below the chart support at the $90 level (there had been several previous lows there). That was a clue that the market was about to challenge and likely break below my lower tramline.
Then, late on 4 February, the market did break sharply below the line and then staged a complex recovery but only to the underside of my lower tramline. As I've noted before, this is typical behaviour, especially when there has been a very sharp initial break.
Then, on 7 February, the market continued falling. So where was it likely to meet support?
How to find support draw more tramlines
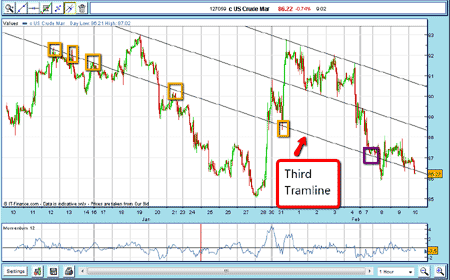
That is where my tramline trading methods come in. If I draw a parallel tramline equidistant below my lower line, this is what we find:

My third tramline passes through significant tops and bottoms (see yellow boxes). This is confirmation that I can rely on the placement of this new line. So now I have a target for the market the purple box.
And this is where it gets interesting. Guess what? The market touched the line on 7 February and then bounced off.
How did I know that this level would provide support? Simply because I have shown that the market has been trading between my sets of tramlines up to that point, and I have no reason to believe that conditions would change.
If I had been trading short-term I could have taken profits on any short positions there.
The market breaks through my third tramline
The market made a further lunge down on 8 February, but then snapped back, as momentum was very oversold. It attempted a rally for a day or so, but then fell back and is trading just below the tramline as I write (on Thursday 10 February).
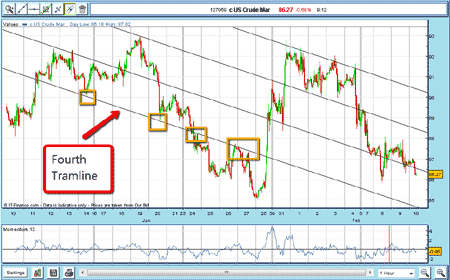
Here is a question: if the market continues to fall (it is in a good downtrend), where is the likely support? Let's draw a fourth tramline equidistant below the third tramline:

Isn't that amazing? My line passes through the significant tops and bottoms from previous trading (see yellow boxes). So there we have a likely candidate for a downside target.
Can the market keep adhering to more and more tramlines drawn from my original upper tramline? As ever in the markets, it will keep working until it stops working!
Now, if trading were this easy, everyone would be doing it. At some stage, the market will of course choose to ignore my ever-lowering tramlines and veer off that script. That is when I will look to establish another tramline pair, trying to find best fits to the highs and lows the market might make.
But sometimes (as in this example), the tramlines just jump out from the chart. That provides the very best trading opportunities, in my experience.
NB: Don't miss my next bit of trading advice. To receive all my spread betting blog posts by email, as soon as I've written them, just sign up here .
Get the latest financial news, insights and expert analysis from our award-winning MoneyWeek team, to help you understand what really matters when it comes to your finances.
John is is a British-born lapsed PhD physicist, who previously worked for Nasa on the Mars exploration team. He is a former commodity trading advisor with the US Commodities Futures Trading Commission, and worked in a boutique futures house in California in the 1980s.
He was a partner in one of the first futures newsletter advisory services, based in Washington DC, specialising in pork bellies and currencies. John is primarily a chart-reading trader, having cut his trading teeth in the days before PCs.
As well as his work in the financial world, he has launched, run and sold several 'real' businesses producing 'real' products.
-
 Ayatollah Ali Khamenei: Iran’s underestimated chief cleric
Ayatollah Ali Khamenei is the Iranian regime’s great survivor portraying himself as a humble religious man while presiding over an international business empire
-
 'AI will change our world in more ways than we can imagine'
Interview Rob Arnott of Research Affiliates talks to Andrew Van Sickle about the AI bubble, the impact of tariffs on inflation and the outlook for gold and China