Has the Dow finally peaked?
Despite huge bullish sentiment, the Dow could be setting up for a huge fall. John C Burford explains what's going on, and how to play it.
Get the latest financial news, insights and expert analysis from our award-winning MoneyWeek team, to help you understand what really matters when it comes to your finances.
You are now subscribed
Your newsletter sign-up was successful
Want to add more newsletters?

Twice daily
MoneyWeek
Get the latest financial news, insights and expert analysis from our award-winning MoneyWeek team, to help you understand what really matters when it comes to your finances.

Four times a week
Look After My Bills
Sign up to our free money-saving newsletter, filled with the latest news and expert advice to help you find the best tips and deals for managing your bills. Start saving today!
As you know, I have been very sceptical of the huge rally that has carried the Dow to the 12,900 area.
In fact, I've refused to trade from the long side and have been looking for solid short trades.
I have simply not gone along with mainstream bullishness of both individual investors and professionals.
MoneyWeek
Subscribe to MoneyWeek today and get your first six magazine issues absolutely FREE

Sign up to Money Morning
Don't miss the latest investment and personal finances news, market analysis, plus money-saving tips with our free twice-daily newsletter
Don't miss the latest investment and personal finances news, market analysis, plus money-saving tips with our free twice-daily newsletter
The way I see it, the gap between hope which is driving the rally and the reality of the gloomy consumer mood is like a yawning chasm. After all, in Western economies, personal consumption is the main driver of economic growth (or decay!)
Why the Dow could be setting up for a huge fall
This is not the place to discuss the 'fundamentals'. But I will say that with bullish sentiment measures almost off the scale, the set-up is complete (or almost so) for a massive disappointment.
That disappointment could come at any time.
Over the past few days, I believe I have seen some striking evidence that the top is in. I'll show you that on the charts later.
But first, let me explain why sentiment readings, such as the American Association of Individual Investors (AAII), are so important to me.
The fact is that, at important market tops (and bottoms, but in reverse), the psychological extreme of bullishness almost always coincides with a major turn. That's what the charts show us.
It is one of the ironies of the markets. Just when most people agree the bull market is set to rocket and a cursory reading of the popular financial press will confirm that is when the market has run out of bulls.
It's at that stage, that only a small degree of selling (from profit-taking or new bears entering) has the potential to start an avalanche of liquidation as stops are run.
The market is at its most vulnerable to a reversal when sentiment is extreme. Trading with the herd at such extremes is often a very hazardous policy.
This chart suggests the reversal has started
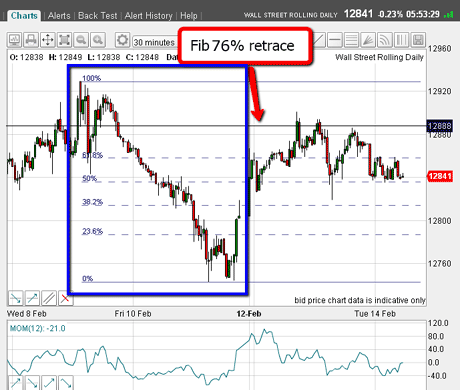
When I last covered the Dow on 1 February, I was looking for a top in the 12,840 area. Since then, my Elliott wave labelling was proved wrong. The market went on to make a new high. This high was at 12,920 last Thursday following the latest eurozone drama, which was supposed to be bullish.
Since then, the market has fallen significantly, in a five-wave Elliott wave pattern. This is the first evidence of a reversal that I mentioned above. I have shown it enclosed in the blue box:

(Click on the chart for a larger version)
Following this pattern, the market rallied after yet another eurozone lifeline, but to the Fibonacci 76% retrace. As I write, the market is falling again.
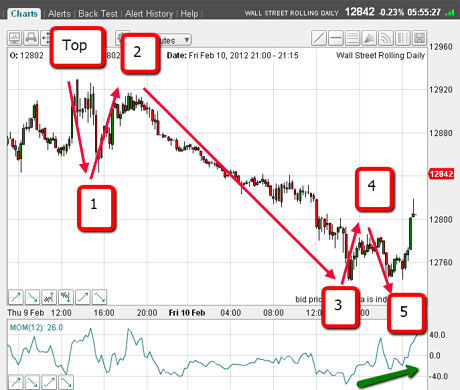
Here is the five-wave pattern in more detail:

The fifth wave is not textbook, as it did not quite make a new low beneath the third wave. But just admire the long and strong' nature of this third wave that is textbook.
As these waves were being put in, note the momentum was getting stronger (my green arrow). This set the scene for a counter-trend rally.
If we are indeed in a new bear move, there are two things I will be looking out for.
Two key levels I'm watching for on the Dow
First, any rally should not take out Thursday's high at 12,920. A move above that would cancel my Elliott wave labelling.
Second, Friday's low in the 12,740 area should be taken out soon. That would confirm my five-wave pattern was indeed the start of a larger down move. Those are my parameters as it currently stands.
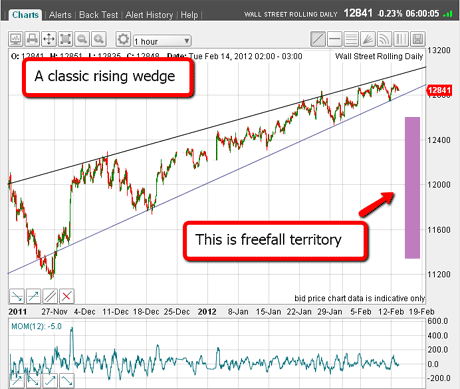
So now, let's back up and look at the slightly bigger picture. Here is the hourly chart showing the rally off the November low:

(Click on the chart for a larger version)
The pattern of this rally is a classic rising wedge. If you are interested in learning about classic chart patterns, I refer you to the bible of pre-computer era technical analysis, "Technical Analysis of Stock Trends" by Edwards and Magee.
I am looking for a break of the lower trendline at some stage. According to Edwards and Magee, when this occurs, the decline should be very rapid and take the market back down to where the wedge started.
I'm looking for shorts in the freefall zone'
I have marked this area as a freefall zone. What could set it off is the massive liquidation from running sell-stops.
Of course, the market could resolve upwards, but this would be an unusual resolution of the wedge formation. As I see things now, the odds currently favour the downside.
Recall also that the market saw a similar five-wave pattern down off the recent top in gold, which I described on 6 February. That, too, has marked the rally top in gold, so far.
The markets seem to be lining up for another wave of liquidation that could rival or exceed the declines of 2008.
I shall continue to look for short-selling opportunities.
If you're a new reader, or need a reminder about some of the methods I refer to in my trades, then do have a look at my introductory videos:
The essentials of tramline trading
An introduction to Elliott wave theory
Advanced trading with Elliott waves
Don't miss my next trading insight. To receive all my spread betting blog posts by email, as soon as I've written them, just sign up here .
Get the latest financial news, insights and expert analysis from our award-winning MoneyWeek team, to help you understand what really matters when it comes to your finances.
John is is a British-born lapsed PhD physicist, who previously worked for Nasa on the Mars exploration team. He is a former commodity trading advisor with the US Commodities Futures Trading Commission, and worked in a boutique futures house in California in the 1980s.
He was a partner in one of the first futures newsletter advisory services, based in Washington DC, specialising in pork bellies and currencies. John is primarily a chart-reading trader, having cut his trading teeth in the days before PCs.
As well as his work in the financial world, he has launched, run and sold several 'real' businesses producing 'real' products.
-
 Barings Emerging Europe trust bounces back from Russia woes
Barings Emerging Europe trust has added the Middle East and Africa to its mandate, delivering a strong recovery, says Max King
-
 How a dovish Federal Reserve could affect you
Trump’s pick for the US Federal Reserve is not so much of a yes-man as his rival, but interest rates will still come down quickly, says Cris Sholto Heaton