We’re at a critical point in the Dow
The rally in the Dow Jones has reached a critical level. A reversal could be on, says John C Burford, but the market could go either way from here as the bulls do battle with the bears.
Get the latest financial news, insights and expert analysis from our award-winning MoneyWeek team, to help you understand what really matters when it comes to your finances.
You are now subscribed
Your newsletter sign-up was successful
Want to add more newsletters?

Twice daily
MoneyWeek
Get the latest financial news, insights and expert analysis from our award-winning MoneyWeek team, to help you understand what really matters when it comes to your finances.

Four times a week
Look After My Bills
Sign up to our free money-saving newsletter, filled with the latest news and expert advice to help you find the best tips and deals for managing your bills. Start saving today!
Let's stick with the Dow today, as it continues to offer some really excellent trading lessons.
I'll show you some really pretty Fibonacci retracements where positions could have been taken, following my trading rules.
On Monday, I made my case for the recent 12,840 high being the top of the stunning rally off the major October low. This was a move of over 2,400 pips in about four months, for a gain of 23%.
MoneyWeek
Subscribe to MoneyWeek today and get your first six magazine issues absolutely FREE

Sign up to Money Morning
Don't miss the latest investment and personal finances news, market analysis, plus money-saving tips with our free twice-daily newsletter
Don't miss the latest investment and personal finances news, market analysis, plus money-saving tips with our free twice-daily newsletter
Naturally, after such a huge move, the bulls will not be giving up the ghost easily! Typically, at major stock market tops, we see lots of churning with wide swings a tremendous battle between the bulls and bears.
That's what we're seeing right now.
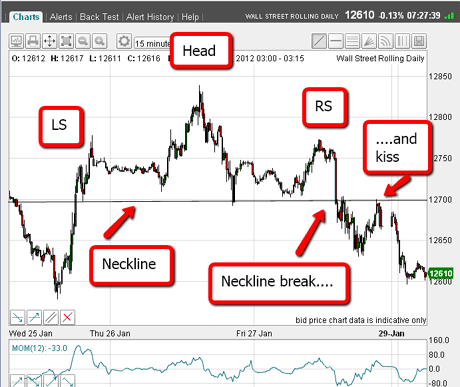
This head and shoulders says the Dow reversal could be on
In fact, I have detected a special five-wave pattern that often signifies a reversal here it is:
(Click on the chart for alarger version)
You can clearly see the five-wave head and shoulders pattern with the head being the 12,840 high with the left (LS) and right (RS) shoulders either side.
We can also see the neckline break at 12,700, and then a retrace to its underside for the traditional 'kiss'. After that, there's a scalded cat bounce down.
This is one more piece of evidence for a top which adds to that I outlined on Monday.
But there's more
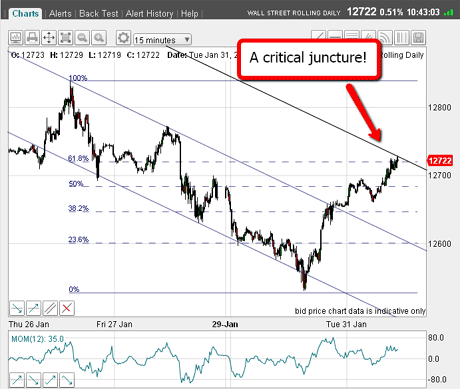
As the market was making its second dip-and-rally off the 12,840 high, I took this chart yesterday:
(Click on the chart for alarger version)
I have drawn on here a lovely tramline trio.
See how the market then was attacking the meeting of the upper tramline and the Fibonacci 62% retrace. That was an excellent place to make a short trade.
But where are we now?
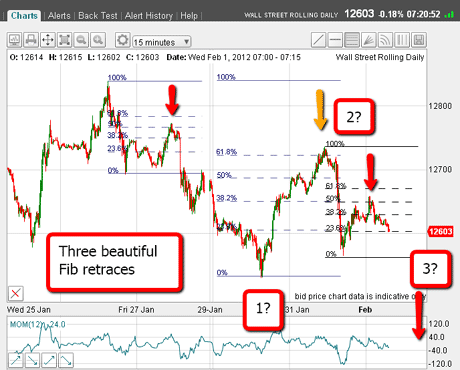
Let's now have a look at market action to this morning:
(Click on the chart for alarger version)
The scalded cat bounce took the market down to the 12,500 area, but then it found support.
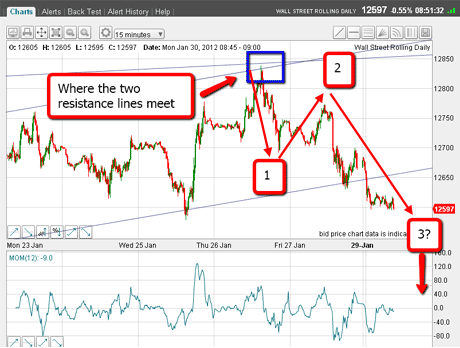
That could have been my wave 3 low as I pencilled in on Monday.
Here's the relevant chart from Monday, so you can see what I mean:
(Click on the chart for alarger version)
So the move higher was not a surprise, as I expected this rally in my wave 4.
But this rally took the market above the wave 1 low at 12,690 made last Thursday.
This is significant, as it destroys my Elliott wave labelling one of the rules is that wave 4 cannot overlap wave 1. So it's back to the drawing board.
Three good chances for shorts from the 12,840 high
But going back to the Fib chart above, if you look at the decline off the 12,840 high, just admire the three separate rallies off the three minor lows.
Each rally reached either a Fibonacci 50% or 62% level. I have placed my Fibonacci tool on each one of them to show these retrace levels.
These were areas where short trades could have been made.
Also note the A-B-C nature of all three rallies, thus confirming they are counter-trend and giving support to a bearish stance.
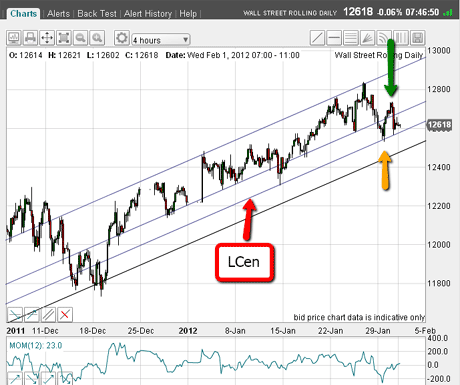
But this latest rally to the 12,730 level is also playing havoc with my tramlines, which I showed on Monday. Here is the updated chart:
(Click on the chart for alarger version)
On Monday, I said that if the market can break support at the 12,600 level, that should herald a quick decline to the lowest tramline.
Why I'm being cautious until I get a clearer picture
The market did in fact break that support, and on Monday, it fell to 12,530 but then rallied hard back up above the support.
That has muddied the waters somewhat and caution is most definitely in order!
Now, from the two spike lows, I can draw a central tramline (marked LCen). If this line can be broken, we should be away to the downside. The key level now is the low marked by the yellow arrow.
But if the market rallies above the high marked by the green arrow, I will need to re-assess my tramlines, as it may well indicate that these lines are not valid now.
Remember: tramlines do peter out, and this could be the time to start looking for new ones.
There is room for the market to rally above the overnight high to form another A-B-C pattern, so a rally to the underside of LCen is allowable. In fact, if this occurs, the A-B-C would look more in proportion.
But with my ideal Elliott wave scenario not playing out as I had imagined, I will be keeping close stops on all my positions.
And if the market rallies above yesterday's 12,740 high, I will definitely re-assess.
At some stage, the fog will clear, and that will be the time for me to be bolder. The very best time to trade is when recognisable patterns jump off the screen, but for me at the moment, that time has not quite come. A little more patience will be required.
If you're a new reader, or need a reminder about some of the methods I refer to in my trades, then do have a look at my introductory videos:
The essentials of tramline trading
An introduction to Elliott wave theory
Advanced trading with Elliott waves
Don't miss my next trading insight. To receive all my spread betting blog posts by email, as soon as I've written them, just sign up here .
Get the latest financial news, insights and expert analysis from our award-winning MoneyWeek team, to help you understand what really matters when it comes to your finances.
John is is a British-born lapsed PhD physicist, who previously worked for Nasa on the Mars exploration team. He is a former commodity trading advisor with the US Commodities Futures Trading Commission, and worked in a boutique futures house in California in the 1980s.
He was a partner in one of the first futures newsletter advisory services, based in Washington DC, specialising in pork bellies and currencies. John is primarily a chart-reading trader, having cut his trading teeth in the days before PCs.
As well as his work in the financial world, he has launched, run and sold several 'real' businesses producing 'real' products.
-
 Average UK house price reaches £300,000 for first time, Halifax says
While the average house price has topped £300k, regional disparities still remain, Halifax finds.
-
 Barings Emerging Europe trust bounces back from Russia woes
Barings Emerging Europe trust has added the Middle East and Africa to its mandate, delivering a strong recovery, says Max King