Has the stunning Dow rally peaked?
The Dow pulled off a spectacular rally recently - but has it reached its stalling point? John C Burford looks to the charts to find out.
Get the latest financial news, insights and expert analysis from our award-winning MoneyWeek team, to help you understand what really matters when it comes to your finances.
You are now subscribed
Your newsletter sign-up was successful
Want to add more newsletters?

Twice daily
MoneyWeek
Get the latest financial news, insights and expert analysis from our award-winning MoneyWeek team, to help you understand what really matters when it comes to your finances.

Four times a week
Look After My Bills
Sign up to our free money-saving newsletter, filled with the latest news and expert advice to help you find the best tips and deals for managing your bills. Start saving today!
I have been focusing on the euro recently, as that market has illustrated several very important trading principles.
Today I want to take a look at the Dow, which is offering some great lessons of its own.
I last covered the Dow on 9 January and a lot of market action has occurred since then. Let's take a look.
MoneyWeek
Subscribe to MoneyWeek today and get your first six magazine issues absolutely FREE

Sign up to Money Morning
Don't miss the latest investment and personal finances news, market analysis, plus money-saving tips with our free twice-daily newsletter
Don't miss the latest investment and personal finances news, market analysis, plus money-saving tips with our free twice-daily newsletter
We need to keep in mind that, for many months now, most asset markets have been trading up and down together more or less.
This is down to the central bank policy of injecting huge waves of liquidity into the banking system through quantitative easing (QE). With businesses and consumers in no mood to accept even more credit since 2008, the extra funds have been channelled into asset markets the risk-on' trade.
In this way, the stock markets are linked to the currency and gold markets in particular. Broadly, the Dow, gold, and the euro are moving up and down together, and should continue to do so for a long time.
Why the Dow's rally looks like it's running out of steam
OK, on 9 January, I had expected the Dow rally off the October low to top in the 12,400 area, as that was in the area of a major support/resistance line.
But since then, the market punched up through that resistance and last week carried to 12,840 on Thursday way above 12,400, of course.
Now, though, it has entered an area where previous rally attempts have been savagely turned back.
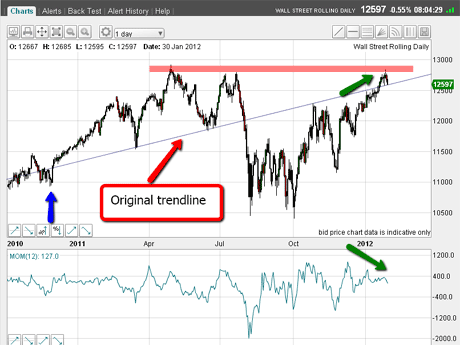
Here is the current daily chart which shows this clearly. See how the Dow has turned sharply lower at resistance marked by the thick red bar:

(Click on the chart for a larger version)
You can see how the market has moved above my original trendline. Having broken above major resistance, does this mean that the rally will continue?
I suspect not, and today I will show you my reasoning.
My original trendline used the major lows of March and June 2011 as pivot points.
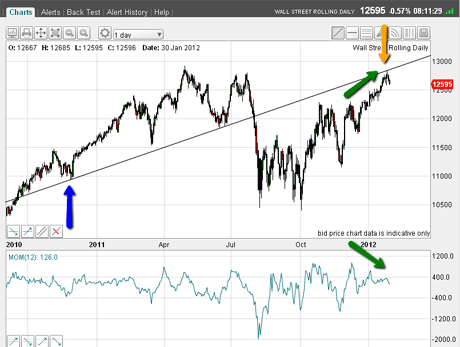
But what if instead of the March point, I use the previous significant low marked by the blue arrow? This is what I find:

(Click on the chart for a larger version)
This is the ideal set-up for a reversal
My new line now is raised with the striking result that the market touched it last week and now is backing off sharply as I write.
Trader tip: Trendline placements are always subject to modification nothing is written in stone in real time. Looking back on old charts can be very misleading, as it gives the impression that identifying the correct Elliott waves, tramlines, and even Fibonacci retracements are child's play. Nothing is further from the truth!
OK, so I now have a new resistance line in the 12,800 area.
But with bearish sentiment still hovering near record lows, this is the ideal set-up for a huge reversal.
Gazing at the chart above, I see the rally off the October low still has the form of a large A-B-C correction as I showed on 9 January.
Meanwhile, the rally off the December low (the above B wave low) also has an A-B-C formation with the market currently in both C waves.
Note also the large potential negative momentum divergences (green arrows). This could spell big trouble for the rally.
So the question is: Has the C wave terminated yet? If it has, we should see a huge move down in a very large third wave with wave 1 the March 2009 low, and wave 2 the May 2011 high.
To get a handle on where we are in this C wave, I need to look at the short-term chart:

(Click on the chart for a larger version)
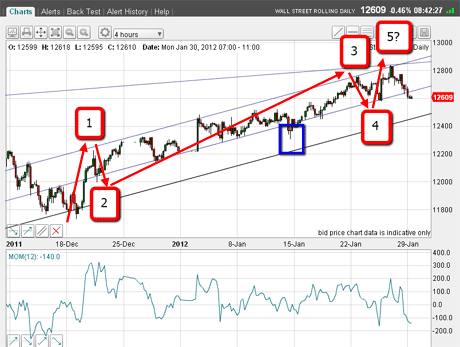
This is the four-hour chart and shows a very good five-wave Elliott wave pattern contained between my tramlines.
Note the long and strong' wave 3, which itself contains a very clear five-wave pattern. The only blemish is the nasty head-fake' where the market dipped below the lower tramline (blue box).
I confess that one fooled me, as I had placed sell orders there, only to be taken out on the subsequent rally.
If we have indeed completed a five-wave pattern within the C waves, that means the next move is down and sharply.
Has the move down started yet?
This morning, the market has moved down below my lower tramline (again) and is challenging Wednesday's low at the 12,600 level. Breaking below that would strengthen my case for Thursday's high at 12,840 as the top.
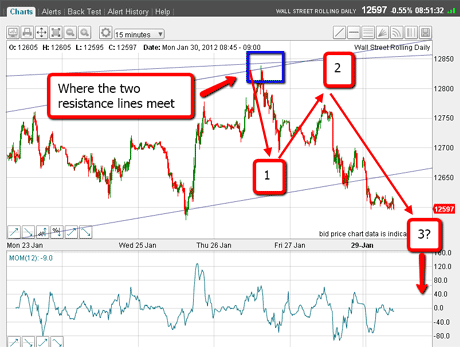
The key for me is for the market to make a small-scale five-wave Elliott pattern off this high. We are currently part-way there, as this chart shows:

(Click on the chart for a larger version)
On this 15-minute chart, we see the Thursday high precisely at the meeting-point of the two lines of resistance. Since then, I can count waves 1 and 2. We are currently in wave 3 down, which should draw prices quickly down another 100 pips at least. That is my favoured scenario.
Already, there have been several excellent points I could have taken short positions.
In my 9 January post, I stated: "Naturally, the market could continue its rally, but with investors' bullish sentiment off the scale, a further push up would rest on very shaky ground".
And so it seems.
If you're a new reader, or need a reminder about some of the methods I refer to in my trades, then do have a look at my introductory videos:
The essentials of tramline trading
An introduction to Elliott wave theory
Advanced trading with Elliott waves
Don't miss my next trading insight. To receive all my spread betting blog posts by email, as soon as I've written them, just sign up here .
Get the latest financial news, insights and expert analysis from our award-winning MoneyWeek team, to help you understand what really matters when it comes to your finances.
John is is a British-born lapsed PhD physicist, who previously worked for Nasa on the Mars exploration team. He is a former commodity trading advisor with the US Commodities Futures Trading Commission, and worked in a boutique futures house in California in the 1980s.
He was a partner in one of the first futures newsletter advisory services, based in Washington DC, specialising in pork bellies and currencies. John is primarily a chart-reading trader, having cut his trading teeth in the days before PCs.
As well as his work in the financial world, he has launched, run and sold several 'real' businesses producing 'real' products.
-
 Average UK house price reaches £300,000 for first time, Halifax says
While the average house price has topped £300k, regional disparities still remain, Halifax finds.
-
 Barings Emerging Europe trust bounces back from Russia woes
Barings Emerging Europe trust has added the Middle East and Africa to its mandate, delivering a strong recovery, says Max King