Where to next for the Dow?
The Christmas rally in the Dow has continued into the New Year, says John C Burford. But now the festivities are over, has the market reached its limit?
Get the latest financial news, insights and expert analysis from our award-winning MoneyWeek team, to help you understand what really matters when it comes to your finances.
You are now subscribed
Your newsletter sign-up was successful
Want to add more newsletters?

Twice daily
MoneyWeek
Get the latest financial news, insights and expert analysis from our award-winning MoneyWeek team, to help you understand what really matters when it comes to your finances.

Four times a week
Look After My Bills
Sign up to our free money-saving newsletter, filled with the latest news and expert advice to help you find the best tips and deals for managing your bills. Start saving today!
My lastpost on the Dow was on 21 December. I suggested that the 'surprise' rally just getting underway could carry on much further.
I wrote: "My feeling is that we shall see moves above the previous 12,300 high soon. But near-term, the market deserves a breather, as it has made a very strong impulsive move."
That is precisely how it has played out.
MoneyWeek
Subscribe to MoneyWeek today and get your first six magazine issues absolutely FREE

Sign up to Money Morning
Don't miss the latest investment and personal finances news, market analysis, plus money-saving tips with our free twice-daily newsletter
Don't miss the latest investment and personal finances news, market analysis, plus money-saving tips with our free twice-daily newsletter
I also wrote: "For reasons I will explain in a future email, a probable target for me might be in the 12,350 12,400 area, provided the old high at 12,300 can be taken out."
OK, this is the time to explain why I set my upper target in the 12,400 area.
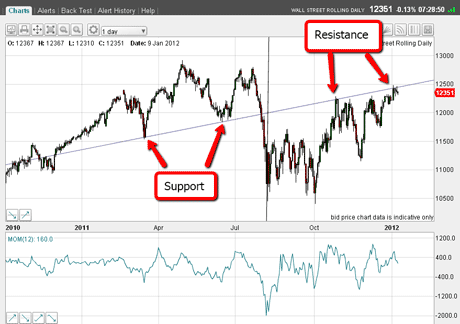
Here is the daily chart going back over a year:

(Click on the chart for a larger version)
Right away, the support/resistance line I have drawn is as clear as a bell. It has acted as support pre-summer 2011, and as resistance post-summer 2011. This demarcation I have drawn with my vertical line.
Since August, volatility has been extreme. Just compare the daily ranges in the two zones, and also try to count the market zig-zags which have been much more numerous since August.
Employing my tramline, Elliott wave, and Fibonacci concepts gave me an edge - this approach was ideally suited for market conditions.
Investors look too bullish on the US
The Santa Claus rally has carried through into the New Year. But now the market is pushing up against the underside of my year-long resistance line.
The crucial question is: will this resistance give way?
Here is some evidence to suggest it will not.
For one thing, a respected poll of investors in the USA (AAII) shows there are only 17% bears a near-record all-time low.
This is not a bullish signal! The vast majority of investors expect conditions to improve in 2012 and the Fed to resume QE operations.
Recall, when the Fed started QE (quantitative easing a euphemism for increasing the dollar supply), the money ended up not in the hands of consumers, but in the banks and institutions.
They promptly pumped up asset markets with it, as there was little or no demand for loans by businesses and individuals.
Investors are expecting a repeat performance. We shall see. If the Fed does announce something, it may be a classic case of "buying the rumour and selling the news".
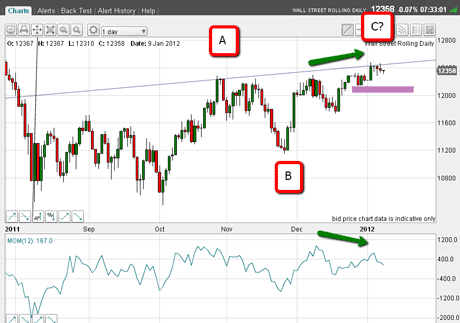
The other point is the Elliott wave patterns shown in a close-up:

(Click on the chart for a larger version)
The rally off the October low can be counted as an A-B-C, which is counter-trend.
My possible C wave also breaks down into an inner A-B-C pattern, complete with a potential negative momentum divergence shown by the green arrows.
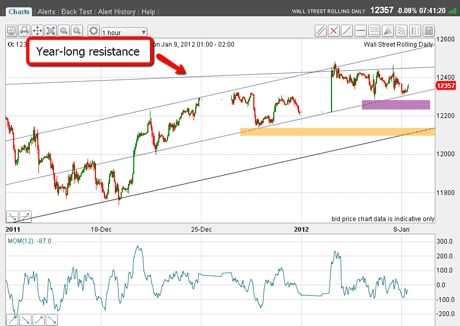
We need an even closer look to see if there are any short-term clues for a potential turn. Here is the hourly chart:

(Click on the chart for a larger version)
The trading since late December can be contained between my tramline pair (the upper two) very nicely.
But on Friday, following the release of the 'bullish' jobs report, the market tried to push up past the year-long line of resistance, but was slapped back down.
This is one clue that the market is probably topping.
Overnight, the market dipped down to the centre line, and is currently respecting the support there.
If there is a top here, then I will expect the market to drop below my purple bar.
Where to next for the Dow?
I have drawn a third tramline. If the market can breach the central one, that will be my first target.
But one very real possibility is that we could see another spike up first (to meet the upper tramline?), then the start of a big decline as sell stops are touched off.
Naturally, the market could continue its rally, but with investors' bullish sentiment off the scale, a further push up would rest on very shaky ground.
The beauty of this style of trading is that the market must prove it has topped by starting a down move and triggering my stops. Many traders just guess what the market will do and jump in head-first, hoping they are right.
But if the market rallies and my sell-stops are not touched, no harm is done to my capital, and I am free to search for other opportunities.
Watch out for a new video tutorial on my 3% rule, coming soon.
If you're a new reader, or need a reminder about some of the methods I refer to in my trades, then do have a look at my introductory videos:
The essentials of tramline trading
An introduction to Elliott wave theory
Advanced trading with Elliott waves
Don't miss my next trading insight. To receive all my spread betting blog posts by email, as soon as I've written them, just sign up here .
Get the latest financial news, insights and expert analysis from our award-winning MoneyWeek team, to help you understand what really matters when it comes to your finances.
John is is a British-born lapsed PhD physicist, who previously worked for Nasa on the Mars exploration team. He is a former commodity trading advisor with the US Commodities Futures Trading Commission, and worked in a boutique futures house in California in the 1980s.
He was a partner in one of the first futures newsletter advisory services, based in Washington DC, specialising in pork bellies and currencies. John is primarily a chart-reading trader, having cut his trading teeth in the days before PCs.
As well as his work in the financial world, he has launched, run and sold several 'real' businesses producing 'real' products.
-
 Average UK house price reaches £300,000 for first time, Halifax says
While the average house price has topped £300k, regional disparities still remain, Halifax finds.
-
 Barings Emerging Europe trust bounces back from Russia woes
Barings Emerging Europe trust has added the Middle East and Africa to its mandate, delivering a strong recovery, says Max King