Why I'm still looking to short gold
Although the rally went on longer than he expected, the charts still point to a bear market in gold, says John C Burford.
Get the latest financial news, insights and expert analysis from our award-winning MoneyWeek team, to help you understand what really matters when it comes to your finances.
You are now subscribed
Your newsletter sign-up was successful
Want to add more newsletters?

Twice daily
MoneyWeek
Get the latest financial news, insights and expert analysis from our award-winning MoneyWeek team, to help you understand what really matters when it comes to your finances.

Four times a week
Look After My Bills
Sign up to our free money-saving newsletter, filled with the latest news and expert advice to help you find the best tips and deals for managing your bills. Start saving today!
When I last covered gold on 23 January, I made a case for the rally off the 29 December low at $1,520 to be ending at the $1,670 area. That was where the market was trading at the time.
Since I wrote that, the rally has blithely ignored my careful analysis and sailed upwards to last week's high at $1,762. That's almost a full $100 above my target. Ouch!
But this brings up a very important point. It starkly illustrates why I use and highly recommend to all traders a tight money-management (or risk-control) strategy, just in case you are wrong.
MoneyWeek
Subscribe to MoneyWeek today and get your first six magazine issues absolutely FREE

Sign up to Money Morning
Don't miss the latest investment and personal finances news, market analysis, plus money-saving tips with our free twice-daily newsletter
Don't miss the latest investment and personal finances news, market analysis, plus money-saving tips with our free twice-daily newsletter
Always listen to what the market is telling you
One of the biggest weaknesses of traders is to convince yourself that your stance is the right one. You hang on to losing positions, even though the market is telling you that something is wrong with it.
In certain areas of life, stubbornness can sometimes be an advantage. But not in trading unless you have very deep pockets. Even then you risk huge losses if the markets never recover.
I trade market swings, which are the short to intermediate time frame market moves. I expect to be holding winning trades typically for a few days to a few weeks, and losing trades for a few minutes to a few days.
In a losing trade, I am taken out by my previously-set stop loss using my 3% rule. In a winning trade, I will adjust my stop loss to break-even when conditions allow, and exit the trade at a pre-defined target price.
OK, so I have had a losing trade. What now?
The charts still point to a bear market in gold
I am still bearish on the gold market. The technical picture remains bearish. But if the market can push above the double top at $1,920 formed last summer, then I may change my stance.
So I am still looking for short trades. Let's look at the daily chart for perspective:

(Click on the chart for a larger version)
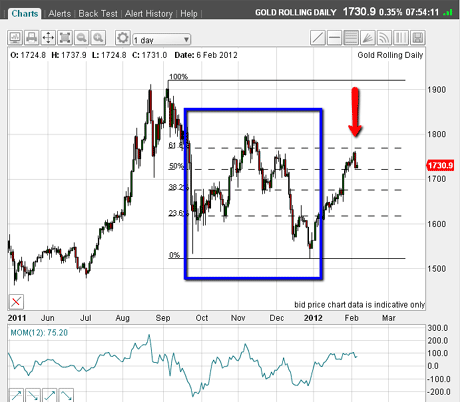
In the blue box, I have highlighted two important Elliott wave formations. The rally off the September plunge low to the November high is an A-B-C, which is corrective to the main trend (down).
Then, the decline off the November high to the 29 December low is a five-wave formation, complete with a 'long and strong' third wave.
This combination of waves is solid evidence that we are still in a bear market. I believe that $200 rally since 29 December is a bear market rally, albeit a very deep one.
Also note that the rally has taken the market to the 62% Fibonacci retracement of the maximum decline off the $1,920 high an important potential line of resistance. So, this level could represent the rally top.
But can I find more evidence for a top? I shall need more than this Fibonacci clue in order to take a view. So now let's look at the shorter-term picture:

(Click on the chart for a larger version)
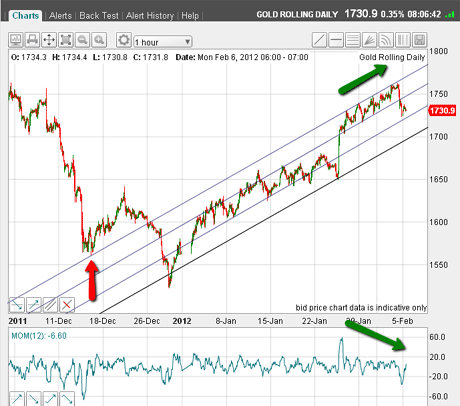
This is the hourly chart showing the $200 uninterrupted rally, and I can show four tramlines. The first tramline I drew was the top one, which takes in the all-important pivot low marked by the red arrow, as well as the recent highs.
The other tramlines, although not perfectly 'clean', are serviceable, so far. On Friday's $35 drop, the market broke below the second tramline the first sign of weakness.
Also, note the potential negative momentum divergence as marked by the green arrows. As the market climbed last week following the Fed interest rate announcement, each new high was made on progressively weaker momentum a sign of an impending reversal.
Fundamentalists would now be asking am I crazy to look for a top here? The Fed has made plain its continuing zero interest rate policy. That's seen as very bullish for gold.
I'm looking for a good entry for a short trade
I can only say that the charts are telling me something very different, and it rarely pays to be part of a herd.
But here is a chart that has me excited:

(Click on the chart for a larger version)
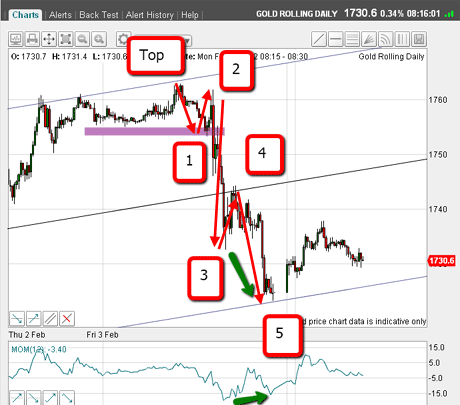
This is the 15-minute close-up of Friday's action. I can spot a very clear 5-wave Elliott pattern, complete with a 'long and strong' third wave and a positive momentum divergence between waves 5 and 3. This is textbook stuff.
The five-wave pattern down is impulsive and indicates the larger trend is now down.
Also, note the decline stopped right on my tramline, also as per the textbook.
I was watching the market closely on Friday for these signs and reckoned that if the market broke below the purple bar, it would indicate a short sale.
This morning, the market is staging a small relief rally, which could form an A-B-C pattern, so this rally may not be yet complete.
If we do get a C wave, that would be an excellent point for me to put out some short trades.
But breaking below Friday's low would confirm my analysis and indicate a much more severe decline lies directly ahead. My first major target is the $1,660 area, with $1,710 as a minor stopping-point (these are Fibonacci levels).
I have a feeling that action this week will be fast and furious.
If you're a new reader, or need a reminder about some of the methods I refer to in my trades, then do have a look at my introductory videos:
The essentials of tramline trading
An introduction to Elliott wave theory
Advanced trading with Elliott waves
Don't miss my next trading insight. To receive all my spread betting blog posts by email, as soon as I've written them, just sign up here .
Get the latest financial news, insights and expert analysis from our award-winning MoneyWeek team, to help you understand what really matters when it comes to your finances.
John is is a British-born lapsed PhD physicist, who previously worked for Nasa on the Mars exploration team. He is a former commodity trading advisor with the US Commodities Futures Trading Commission, and worked in a boutique futures house in California in the 1980s.
He was a partner in one of the first futures newsletter advisory services, based in Washington DC, specialising in pork bellies and currencies. John is primarily a chart-reading trader, having cut his trading teeth in the days before PCs.
As well as his work in the financial world, he has launched, run and sold several 'real' businesses producing 'real' products.
-
 Three key winners from the AI boom and beyond
James Harries of the Trojan Global Income Fund picks three promising stocks that transcend the hype of the AI boom
-
 RTX Corporation is a strong player in a growth market
RTX Corporation’s order backlog means investors can look forward to years of rising profits