You are now subscribed
Your newsletter sign-up was successful
Want to add more newsletters?

Twice daily
MoneyWeek
Get the latest financial news, insights and expert analysis from our award-winning MoneyWeek team, to help you understand what really matters when it comes to your finances.

Four times a week
Look After My Bills
Sign up to our free money-saving newsletter, filled with the latest news and expert advice to help you find the best tips and deals for managing your bills. Start saving today!
When I set out writing these short articles on trading, I specifically limited myself to the very large markets of stock indexes, FX, gold, and crude oil. That was one of my rules. One reason is that these markets have shown themselves to be as close to 'free' as is possible in today's politically-driven markets, and therefore amenable to analysis by classic Elliott wave and Fibonacci (EWF) concepts.
But, of course, some very large cap stocks, although not as 'free' as the large indexes, can, at times, be analysed using EWF methods. I have noticed recently that Barclays (LSE: BARC) has been conforming closely to EWF. This is a share owned by a lot of people, either directly, or in pension and other funds. Also, unlike other major UK banks, Barclays did not receive a bail-out loan from the government, which means its finances reflect more of a free market entity than do the other major UK banks.
MoneyWeek
Subscribe to MoneyWeek today and get your first six magazine issues absolutely FREE

Sign up to Money Morning
Don't miss the latest investment and personal finances news, market analysis, plus money-saving tips with our free twice-daily newsletter
Don't miss the latest investment and personal finances news, market analysis, plus money-saving tips with our free twice-daily newsletter
Barclays' collapse came in five waves
Here is the daily chart for Barclays going back to 2006. In the heady days of the credit bubble, pre-2007, banks were making vast profits from investment banking, and of course, the property market. I'm sure you don't need me to go over what happened next!
The interesting point is that Barclays' share price topped out in the early part of 2007, well before the FTSE 100. That was a big warning flag to technical traders. Then, as the credit bubble burst, Barclays was driven down from £8 to 47p in two years an incredible fall of 94%. But look at the form of the decline it is a five-wave Elliott wave affair.
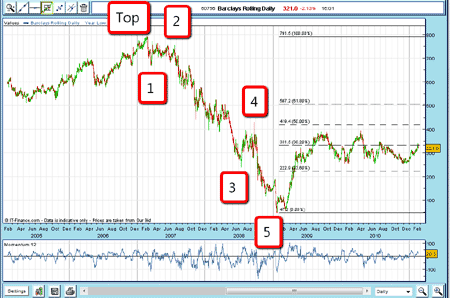
(Click on the chart for a larger version)
Wave 3 is complex, and can be seen to have a five-wave structure itself a typical feature of third waves. Then, wave 5 occurs with a minor positive divergence with momentum. All the ingredients are there for a turn-around at this point. This five-wave pattern confirms we have a new downtrend.
The rebound
OK, after this large five-wave Elliott wave pattern, we expect a corrective rebound which should last months.
This rebound should take the form of a three-wave pattern, and that is what we find:
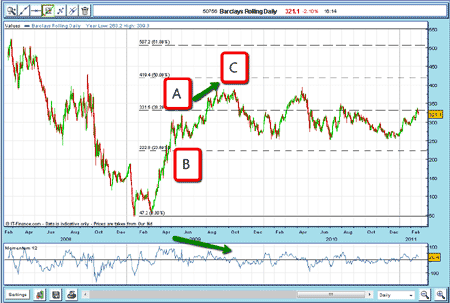
(Click on the chart for a larger version)
And wave C occurs with a striking negative divergence (green arrows) with momentum! This is starting to look like textbook stuff here. I have drawn in the Fibonacci retrace levels using the 791p high as the high pivot, and the 47p low as the low pivot. Wave C lies between the 38.2% and the 50% levels, which means the Fibonacci levels were not operative during this correction but I won't abandon them just yet. They will come into play later on.

Claim your FREE report: The 6-step game-plan for
spread betting profits
After wave C was put in place, the share price drifted for over a year and made no real progress in either direction. All the while, the FTSE has been powering ahead. This divergence, I believe, is significant.
Barclays treads water for over a year
So, for over a year, Barclays has been treading water in what we call a congestion zone, bounded by the 390 and 250 levels.
So far, in 2011, the market has risen, but only to the 330 area the exact Fibonacci 38.2% retrace level! Here is the most recent trading.
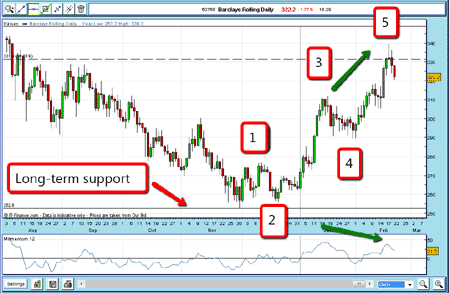
(Click on the chart for a larger version)
The rally since November has accompanied the FTSE 100 up, and has occurred in a five-wave Elliott wave pattern with wave 5 rising to the original Fibonacci 38.2% retrace level. And wave 5 also shows a negative divergence with momentum (green arrows), just to cap it off.
Isn't that convenient?
As I write, the market is backing off the Fibonacci 31.8% level, having completed the five-wave pattern. From here, I would expect a three-wave pattern down. If I were looking to trade Barclays, I would set the Fibonacci levels on my chart using the wave 5 high as high pivot and the various low points since November as my low pivots.
Using my 3% rule, I would set my protective stops reasonably close to my entry points, which are close to the Fibonacci levels. This way, I would be taking low-risk trades an ideal way to trade for maximum profit against minimum risk.
NB: Don't miss my next bit of trading advice. To receive all my spread betting blog posts by email, as soon as I've written them, just sign up here .
-
 Average UK house price reaches £300,000 for first time, Halifax says
While the average house price has topped £300k, regional disparities still remain, Halifax finds.
-
 Barings Emerging Europe trust bounces back from Russia woes
Barings Emerging Europe trust has added the Middle East and Africa to its mandate, delivering a strong recovery, says Max King

