A tough but profitable Dow Jones trade
This trade made use of Elliot wave theory and Fibonacci retracement to make a profitable contrarian bet on the Dow Jones.
Get the latest financial news, insights and expert analysis from our award-winning MoneyWeek team, to help you understand what really matters when it comes to your finances.
You are now subscribed
Your newsletter sign-up was successful
Want to add more newsletters?

Twice daily
MoneyWeek
Get the latest financial news, insights and expert analysis from our award-winning MoneyWeek team, to help you understand what really matters when it comes to your finances.

Four times a week
Look After My Bills
Sign up to our free money-saving newsletter, filled with the latest news and expert advice to help you find the best tips and deals for managing your bills. Start saving today!
Some trades are harder to execute than others. To grasp this one, you'll need to have at least a rough idea of how Elliott waves and Fibonacci principles work. But then, as with most things in life, there is no gain without at least some pain.
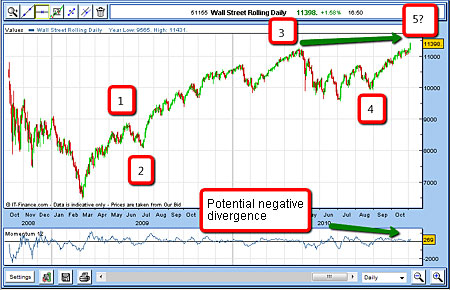
In early November, I was tracking the Dow as it made a series of overlapping rallies since hitting a low in late August. With the market having rallied sharply since the March 2009 low (which was around the 6,500 area), I wasn't interested in taking long trades, not even on a short-term basis. The risks were just too high.
Always look for what the crowd is doing and avoid copying them
Why? Because the measures of investor and trader enthusiasm for stocks were practically off the scale. One very reliable measure of trader sentiment is the daily reading of sentiment of S&P traders (probably the biggest group), which is published by trade-futures.com.
MoneyWeek
Subscribe to MoneyWeek today and get your first six magazine issues absolutely FREE

Sign up to Money Morning
Don't miss the latest investment and personal finances news, market analysis, plus money-saving tips with our free twice-daily newsletter
Don't miss the latest investment and personal finances news, market analysis, plus money-saving tips with our free twice-daily newsletter
As the market rallied this summer into November, the DSI (Daily Sentiment Index) steadily rose and reached more than 95% on many days close to all-time records. In other words, the market was running out of available bears to sell to the many bulls. When this happens, the bulls can suffer exhaustion. Even a modest degree of selling can produce a snowball effect with prices plunging far faster than they rose.
The other important measure of bullish sentiment is the data issued by the American Association of Individual Investors (AAII). This is a weekly poll of retail investors (the 'public'). It asks its members whether they are bullish or bearish on stocks. Into November, the difference between bulls and bears reached an almost-record 30%. This was identical to the reading in November 2007. Back then the market was sitting right on the all-time Dow peak, prior to the biggest collapse in 80 years.
These two indicators are extremely reliable at flagging big reversals when they reach extreme readings. No way was I going to take a long position!
Opportunity knocks
Then on 4 November, stocks made a big thrust up as investors reacted positively to a 'bullish' US economic report. This was the opportunity I was looking for. I knew the bear market rally had carried beyond the Fibonacci 61.8% retracement level. It was certainly possible the rally could carry on to the next Fibonacci level (about another 1,000 points). But glancing at the S&P chart, its rally had only carried it to the exact 61.8% level.
Should I ignore the overshoot in the Dow Jones? That's a question I couldn't get out of my mind all through this trade.
Within this big upward push, I could now count five Elliott waves:

As we've seen before, when the market makes a five-wave pattern, the fifth wave is a finishing wave so a change in trend is indicated. In other words, the market should start correcting.
Time to go short
The moment had come, and I had to make a decision. Was I to short this rally? I decided to wait until the next day, 5 November, to see if the market could maintain it.
Very often, the day after a big move offers us the key clues about direction.
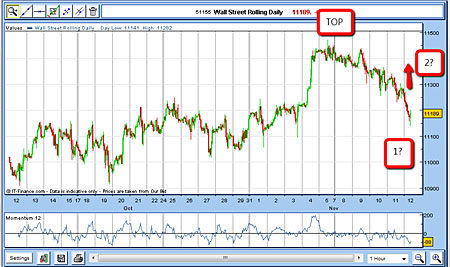
On 5 November, the market rallied a bit further to around 11,470. My finger was poised over the 'sell' button. After drifting down a touch, I pulled the trigger and shorted at 11,430. I had worked out my risk beforehand. I decided on 75 pips using my 3% rule. I suspected that any further rallies would be hard-won, as most short-covering had surely been done on the day before.
5 November sold £2 rolling Dow @ 11,430.
Protective stop @ 11,505
Risk £150 (3%)
I felt the next few days would be crucial for my trade. But on 6 November, the market went to sleep! Ideally, I wanted to see a sharp fall within one to three days. Then on the next day, the market rallied to above the 11,400 level, roughly back to my entry point. Should I have resigned myself to being stopped out?
Discretion is often the better part of valour
No. I left my stop unmoved and watched as the market edged down again in hesitant steps. I had expected the market to sell off more sharply than this, and that was a warning. So as the market moved down to the 11,300 level on 10 November, I moved my stop to break-even, using my break-even rule.
On 12 November, the market had moved down to around 11,200 on low momentum. But I felt another rally was on the cards. I decided not to outstay my welcome and covered my trade while the going was good.

12 November covered rolling Dow @ 11,189.
Profit 241 pips (£482 on risk of £150)
The move to the low was possibly the first wave in a three-Elliott wave sequence. So I could expect the rally to be wave 2, which could cover a lot of ground. In fact, wave 2 could have rallied back to the 11,400 area again. I was not prepared to give up my profit, so I covered. Often in trading, discretion is the better part of valour.
Get the latest financial news, insights and expert analysis from our award-winning MoneyWeek team, to help you understand what really matters when it comes to your finances.
John is is a British-born lapsed PhD physicist, who previously worked for Nasa on the Mars exploration team. He is a former commodity trading advisor with the US Commodities Futures Trading Commission, and worked in a boutique futures house in California in the 1980s.
He was a partner in one of the first futures newsletter advisory services, based in Washington DC, specialising in pork bellies and currencies. John is primarily a chart-reading trader, having cut his trading teeth in the days before PCs.
As well as his work in the financial world, he has launched, run and sold several 'real' businesses producing 'real' products.
-
 Average UK house price reaches £300,000 for first time, Halifax says
While the average house price has topped £300k, regional disparities still remain, Halifax finds.
-
 Barings Emerging Europe trust bounces back from Russia woes
Barings Emerging Europe trust has added the Middle East and Africa to its mandate, delivering a strong recovery, says Max King