Is the Nasdaq killing the bull market?
The Nasdaq's high-flying tech stocks are being dumped for 'safer' Dow equities. Here's what that means for John C Burford's next trade.
Get the latest financial news, insights and expert analysis from our award-winning MoneyWeek team, to help you understand what really matters when it comes to your finances.
You are now subscribed
Your newsletter sign-up was successful
Want to add more newsletters?

Twice daily
MoneyWeek
Get the latest financial news, insights and expert analysis from our award-winning MoneyWeek team, to help you understand what really matters when it comes to your finances.

Four times a week
Look After My Bills
Sign up to our free money-saving newsletter, filled with the latest news and expert advice to help you find the best tips and deals for managing your bills. Start saving today!
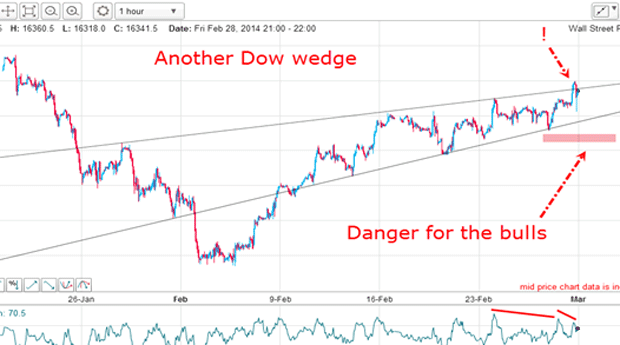
The Dow chart has thrown up several wedge patterns over the past few years at the major highs. This has been a consistent theme and just this week, there is yet another one on the hourly chart.
A wedge is basically a sloping triangle with the two lines sloping either up or down. When appearing at the end of a long trend, it very often signals a reversal. And that is a tradable event.
Many of these wedges in the Dow have resolved to the downside usually with a very sharp break. This has enabled me to get on board several short trades early and ride it for hundreds of pips profit.
MoneyWeek
Subscribe to MoneyWeek today and get your first six magazine issues absolutely FREE

Sign up to Money Morning
Don't miss the latest investment and personal finances news, market analysis, plus money-saving tips with our free twice-daily newsletter
Don't miss the latest investment and personal finances news, market analysis, plus money-saving tips with our free twice-daily newsletter
Remember, these winning short trades were made in an ongoing major bull market. And they appear to give credence to the common advice that you should never trade against the trend.
But I have always had a problem with this advice.
Declines are usually steeper than rallies
And all it would take is a small dip to set them off and a large cascading decline would be set in motion. This produces a very quick swing trade profit for those who have established short positions ahead of the break.
These sharp declines often take away gains in hours and days that the bulls have taken days or weeks or months to build up. I like that.
This gives rise to the expression: "Markets climb the stairs slowly, but fall out of the window quickly". You can see on almost every chart that declines are very often steeper than the rallies.
Not only that, but there is a chance that one particular dip could lead to something much bigger a large-scale change of trend. And it is these trades that can give you a big trade. But forecasting when one of these dips will turn into a rout just as is occurring in gold currently is never easy.
Is the bull market over?

In the above chart, I reckoned a break of the lower wedge line could spell danger for the bulls. After all, previous wedge line breaks have resulted in large down moves.
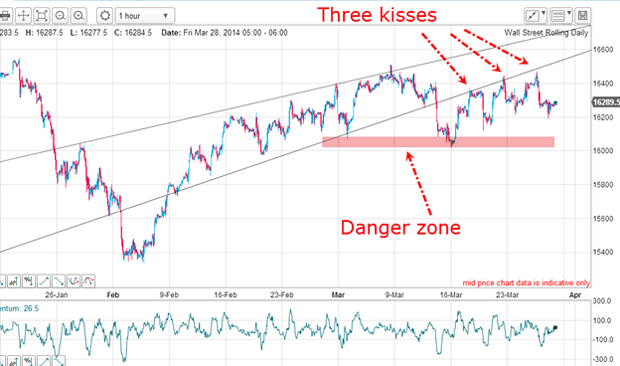
Let's update the above chart as it may shed some light on whether the market is poised for a very large leg down:

The short answer is: not yet. Although the market did fall into the danger zone, it did not break it and it has made a series of highly over-lapping waves back towards my lower wedge line. In fact, it has made three kisses on this line, indicating how important the market considers this line of resistance.Isn't that pretty?
From any of these kisses, a trader could take a short position with the view that the decline off it could be a scalded cat bounce and hence lead to much lower values.
But each time, the market found support and rallied back to the line. The bull market just won't give up!
Why I think the Nasdaq bubble is ending

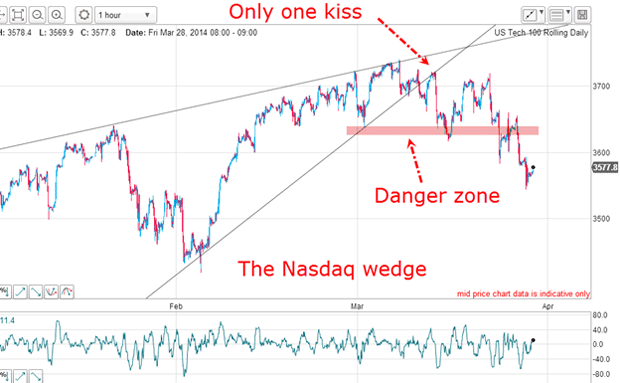
The wedge break earlier this month has resulted in only one kiss a sign of relative weakness compared with the Dow. And my danger zone has been broken with the market currently trading beneath it unlike in the Dow. This wedge has certainly followed the trend by alerting me to a sharp break.
With the Nasdaq weaker than the Dow, it means that the high-flying tech equities are being abandoned in favour of the more conservative Dow components in a flight from risk. This is a complete turn-around from the picture until recently, where the leaders on the Nasdaq were trading in a parabolic fashion. This is always a sign of irrational exuberance' (or mania' or bubble' as I call it).
As an example, Google is falling to earth. Have a look at the chart!
What a new set of tramlines tells me

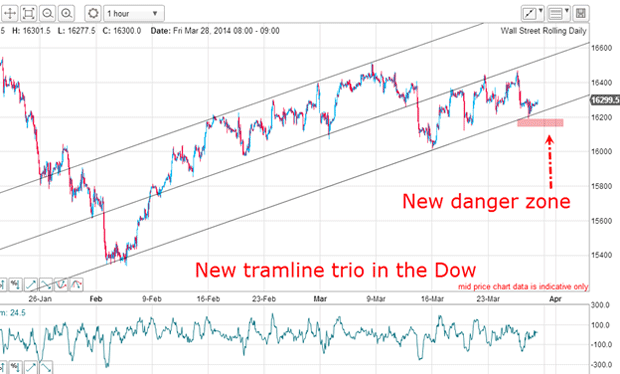
Indeed I can. I have lost the upper wedge line but retained the lower wedge line. So that becomes the central tramline now.
From this line, I can draw a solid lower tramline which takes in the three very important low touch points and also the highest tramline, taking in the highs of the February March period. I am very happy with this tramline set.
And with these tramlines, I have a new danger zone. If the market can follow the Nasdaq lower and break the lowest tramline and test the danger zone, we may have that elusive sharp break I am looking for. And that would be tradable.
Get the latest financial news, insights and expert analysis from our award-winning MoneyWeek team, to help you understand what really matters when it comes to your finances.
John is is a British-born lapsed PhD physicist, who previously worked for Nasa on the Mars exploration team. He is a former commodity trading advisor with the US Commodities Futures Trading Commission, and worked in a boutique futures house in California in the 1980s.
He was a partner in one of the first futures newsletter advisory services, based in Washington DC, specialising in pork bellies and currencies. John is primarily a chart-reading trader, having cut his trading teeth in the days before PCs.
As well as his work in the financial world, he has launched, run and sold several 'real' businesses producing 'real' products.
-
 Average UK house price reaches £300,000 for first time, Halifax says
While the average house price has topped £300k, regional disparities still remain, Halifax finds.
-
 Barings Emerging Europe trust bounces back from Russia woes
Barings Emerging Europe trust has added the Middle East and Africa to its mandate, delivering a strong recovery, says Max King