Is the euro about to turn in the charts?
Sentiment is running high on the euro. John C Burford applies Elliot wave theory to the charts to find out where the single currency is heading next.
Get the latest financial news, insights and expert analysis from our award-winning MoneyWeek team, to help you understand what really matters when it comes to your finances.
You are now subscribed
Your newsletter sign-up was successful
Want to add more newsletters?

Twice daily
MoneyWeek
Get the latest financial news, insights and expert analysis from our award-winning MoneyWeek team, to help you understand what really matters when it comes to your finances.

Four times a week
Look After My Bills
Sign up to our free money-saving newsletter, filled with the latest news and expert advice to help you find the best tips and deals for managing your bills. Start saving today!
In my post on the euro on 11 November, I outlined a model I use to analyse market action. It is completely different from that used by most pundits.
In that post, the euro had just suffered a sharp decline. The most common explanation' for this drop was a series of current events. As I said then, this is all post facto rationalisation and does nothing to help you secure a profitable trade. You would have needed this information before the event and sadly, pundits are unable to provide that for you.
I believe markets are moved by changes in sentiment, and that the subsequent news flow is a result of these mood changes. These changes produce the swings in the charts that can often be analysed by the Elliott wave theory (EWT). One of its great benefits is that it can very often give high-confidence forecasts.
MoneyWeek
Subscribe to MoneyWeek today and get your first six magazine issues absolutely FREE

Sign up to Money Morning
Don't miss the latest investment and personal finances news, market analysis, plus money-saving tips with our free twice-daily newsletter
Don't miss the latest investment and personal finances news, market analysis, plus money-saving tips with our free twice-daily newsletter
That is what we are looking for as traders a reliable method that can forecast a move before the news emerges to justify it.
Why has the euro recovered?
Of course, you could say that new data has emerged to reverse the decline. But that is pure rationalisation and won't help in making you money. Was this information available to you at the low? Of course not. According to this model, you needed that data before it was released to produce a profit a logical impossibility.
No, the market rallied because the EW pattern was not complete. Let me show you what I mean.
This was the daily chart back in November:
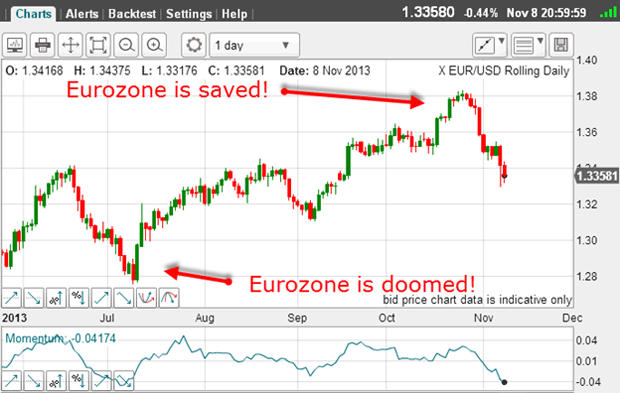
Sentiment towards the eurozone had swung from one pole to the other in just a few months. But the crucial point is that the euro has traced out a three-wave A-B-C pattern to the 1.38 level, and these patterns are counter-trend.
Not only that, but the decline off the 1.38 high has a classic five motive waves down. This was the situation in November:
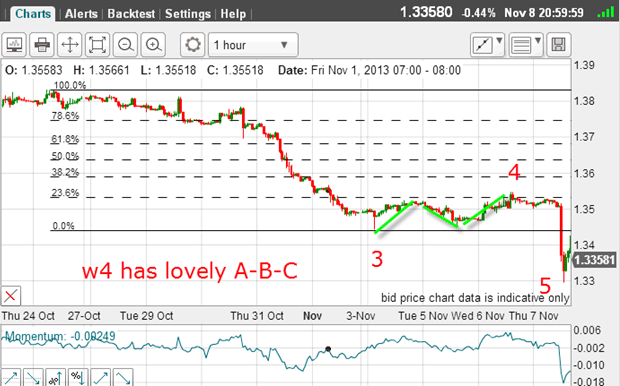
Note that my wave 5 occurred right after the ECB rate cut news. Conventional analysts would conclude that the euro would continue weaker as the news was getting more and more bearish.
The benefits of using Elliot wave theory
So let's see how the market has developed since then.
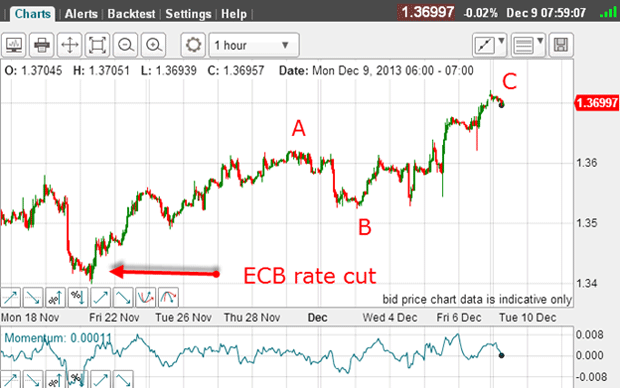
The ECB rate cut event was the low (my wave 5) and the rally since then is a clear A-B-C (so far). There is no other sensible interpretation for this rally. And note the B wave has itself an A-B-C form an absolute textbook example, in fact.
Not only that, but the C wave terminated at the 38% retrace of the leg up from the 1.34 low. Remember, applying your Fibonacci tool to the most recent wave can give likely areas of support/resistance.
All I did was apply basic EWT to the decline off the 1.38 high to the rate cut low to forecast an A-B-C rally. I did not need any news! And this highlights one of the great benefits of using EWT you can virtually ignore the news. Or rather, you can use the news to apply contrary analysis. That is its most valuable use.
Have we reached a turning point?
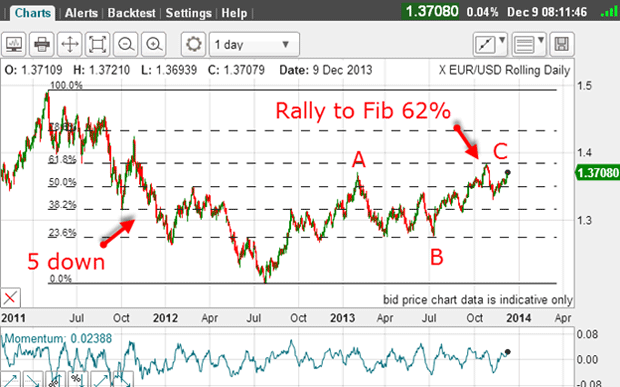
From the 2011 top, the market declined in five waves. The main trend is therefore down. And the C wave terminated at the precise Fibonacci 62% retrace at 1.38.
This is textbook action for a bear market. The conclusion is that all rallies are counter-trend and will be reversed at some point and that new lows are likely.
But have we reached a turning point today?
Here is the current hourly chart:
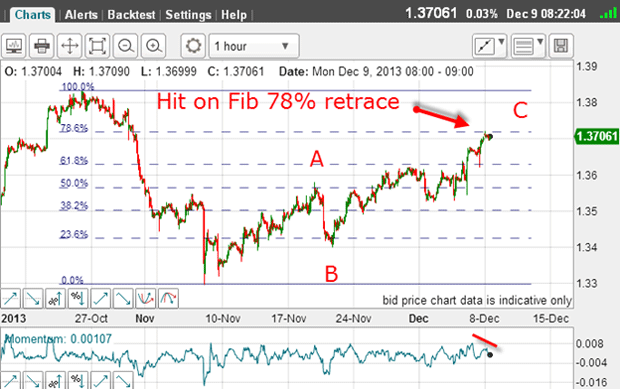
The C wave has carried to the exact Fibonacci 78% level following the US jobs data on Friday, which was interpreted as being dollar-bearish. This is because the consensus says that the Fed will start tapering this month.
Incidentally, note the A wave terminated right at the Fibonacci 50% level a common turning point. If the current C wave terminates at this 78% level, the small negative-momentum divergence (red bar) will morph into something much larger.
One important event to watch is the upcoming Fed meeting on 17/18 December. This is when many expect the Fed to announce they will begin tapering their bond purchases, and by extension start to remove support for stocks. This means that many markets will remain nervous until then (and beyond). That includes the currencies.
The market could rally further and still retain the A-B-C form. That is always possible. But the 1.38 level represents strong resistance and it would take a huge effort to break above it. A dramatic Fed announcement next week could do it, but with the major trend down, rallies should be short-lived.
Get the latest financial news, insights and expert analysis from our award-winning MoneyWeek team, to help you understand what really matters when it comes to your finances.
John is is a British-born lapsed PhD physicist, who previously worked for Nasa on the Mars exploration team. He is a former commodity trading advisor with the US Commodities Futures Trading Commission, and worked in a boutique futures house in California in the 1980s.
He was a partner in one of the first futures newsletter advisory services, based in Washington DC, specialising in pork bellies and currencies. John is primarily a chart-reading trader, having cut his trading teeth in the days before PCs.
As well as his work in the financial world, he has launched, run and sold several 'real' businesses producing 'real' products.
-
 How should a good Catholic invest? Like the Vatican’s new stock index, it seems
The Vatican Bank has launched its first-ever stock index, championing companies that align with “Catholic principles”. But how well would it perform?
-
 The most single-friendly areas to buy a property
There can be a single premium when it comes to getting on the property ladder but Zoopla has identified parts of the UK that remain affordable if you aren’t coupled-up