Why did the EUR/USD fall hard last week?
While the newspapers are full of explanations for why the euro fell last week, traders need only look to the charts, says John C Burford.
Get the latest financial news, insights and expert analysis from our award-winning MoneyWeek team, to help you understand what really matters when it comes to your finances.
You are now subscribed
Your newsletter sign-up was successful
Want to add more newsletters?

Twice daily
MoneyWeek
Get the latest financial news, insights and expert analysis from our award-winning MoneyWeek team, to help you understand what really matters when it comes to your finances.

Four times a week
Look After My Bills
Sign up to our free money-saving newsletter, filled with the latest news and expert advice to help you find the best tips and deals for managing your bills. Start saving today!
Conventional analysis will tell you that the European Central Bank (ECB) rate cut, the US GDP number on Thursday and the jobs data on Friday surprised' the market and lifted the dollar.
Of course, you can read much more detailed and involved commentary around this theme, but that will be the basic explanation' for the sharp fall in the euro.
As you must know by now, I have a totally different take on the markets than that provided by most pundits.
MoneyWeek
Subscribe to MoneyWeek today and get your first six magazine issues absolutely FREE

Sign up to Money Morning
Don't miss the latest investment and personal finances news, market analysis, plus money-saving tips with our free twice-daily newsletter
Don't miss the latest investment and personal finances news, market analysis, plus money-saving tips with our free twice-daily newsletter
The problem with the conventional analysis is that it is 'post facto'. This means that it is a rationalisation for a move that has already happened.
The question traders must therefore ask is this: can this help me make profits, or am I wasting my time reading such material? In other words, can reading about markets after the event help me take a position ahead of it?
This is, in fact, nonsense unless you possess a time machine. Otherwise, the move is over and you are still left without a profit.
What we all need as traders is a way of positioning in advance of such moves and thereby making those profits.
And that is where my methods can help and in this case, the Elliott wave model can really help.
Following the roadmap
This was the Elliott wave count on the hourly chart I had working then:
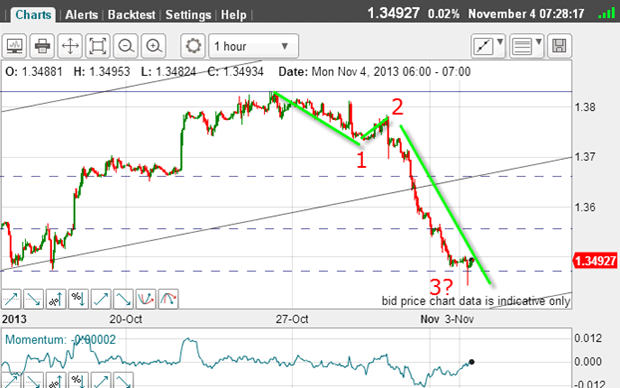
The very sharp down move on 31 October was entirely in keeping with a third wave because it was long and strong, with few green bars and many red ones.
Also, momentum readings reached very low levels, proving the strength of selling.
This was my first sign that the trend had likely changed. To clinch it, I needed to see five impulsive waves down.
When I took the chart, this third wave was probably ending there at the 62% Fibonacci retrace level. And a wave 4 up was likely before a resumption of the downtrend into wave 5.
That wave 4, if it materialised, would have been an excellent place to enter a low-risk short trade.
That was my roadmap.
Let's see how that panned out:
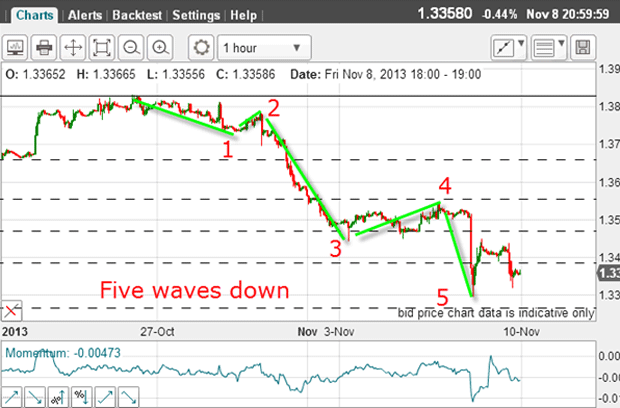
How about that? My wave 3 did terminate at the Fibonacci 62% retrace, and I did get my wave 4 up and then a new low in wave 5 on Friday after the jobs data. That was what I was looking for.
The answer I was looking for
This is about as textbook as you will see and one reason, incidentally, why I love trading the EUR/USD. It displays excellent Elliott waves, tramlines and Fibonaccis.
I recommend all traders take a serious look at trading this market above all else.
Also note the textbook A-B-C pattern in wave 4 again, indicating the immediate trend is down, and giving added confidence for a short trade:
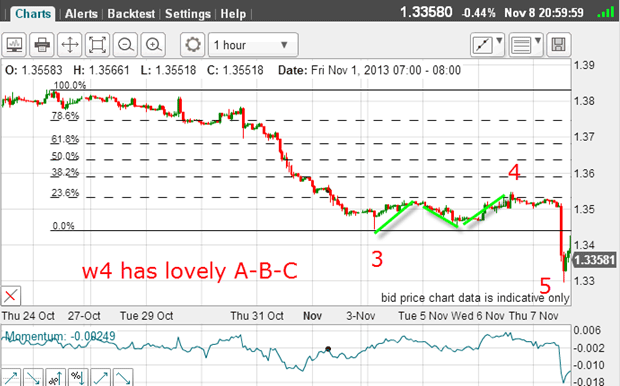
And wave 4 terminated at the Fibonacci 23% retrace of waves 1-to-3 another great place to enter a short trade.
Knowing when to go against the tide
But of course, most traders have been very bullish the euro lately. If you were in that herd, you would have been caught out, sadly. But it didn't have to be!
By reading the signs that I have written about, you would have exited any long trades and then positioned short.
I find most novice (and not so novice) traders cling to a view for way too long. Yes, being bullish the euro was correct since July. But back then, this was a minority opinion! In the summer, there was much chatter about the eurozone breaking up and sentiment was very bearish.
It took courage to go against that story.
How sentiment drives the market
Naturally, this set the scene for a resurgence in the dollar!
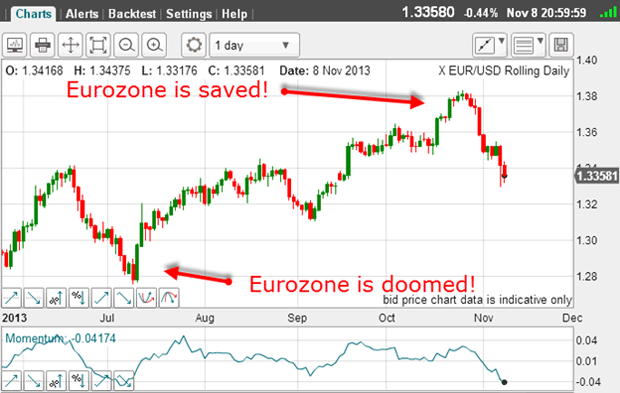
This is how sentiment drives markets. Sentiment extremes in the euro have produced these major turns.
When the EUR/USD trades much lower, I am sure stories of the doomed euro will re-surface.
Now with the US government back at work, I can now access the latest commitments of traders (COT) data:
| (Contracts of EUR 125,000) | Row 0 - Cell 1 | Row 0 - Cell 2 | Row 0 - Cell 3 | Open interest: 252,554 | ||||
| Commitments | ||||||||
| 103,333 | 70,190 | 6,975 | 93,269 | 124,922 | 203,577 | 202,087 | 48,977 | 50,467 |
| Changes from 10/29/13 (Change in open interest: -30,369) | ||||||||
| -32,721 | 4,753 | 1,167 | 5,807 | -31,418 | -25,747 | -25,498 | -4,622 | -4,871 |
| Percent of open in terest for each category of traders | ||||||||
| 40.9 | 27.8 | 2.8 | 36.9 | 49.5 | 80.6 | 80.0 | 19.4 | 20.0 |
| Number of traders in each category (Total traders: 186) | ||||||||
| 44 | 62 | 24 | 51 | 54 | 109 | 126 | Row 8 - Cell 7 | Row 8 - Cell 8 |
The hedge funds (non-commercials) are still net long, but reduced their longs by a whopping amount in the previous week. I guess they didn't like the 300-pip hit that week!
But now, with a chunk of the long positions removed, the market is more evenly balanced.
With my five waves down on the hourly chart, I expect some sort of a bounce. This is especially true, now that the decline has hit the Fibonacci 50% retrace on the nose, and is entering a chart congestion zone (see last Wednesday's post):
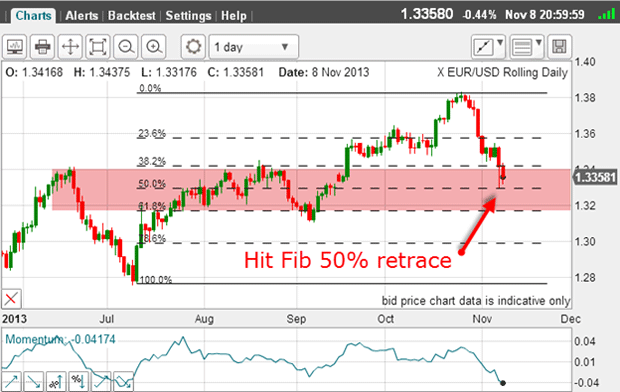
If I do get my bounce, I will be on the lookout for new tramlines and trading off these.
Get the latest financial news, insights and expert analysis from our award-winning MoneyWeek team, to help you understand what really matters when it comes to your finances.
John is is a British-born lapsed PhD physicist, who previously worked for Nasa on the Mars exploration team. He is a former commodity trading advisor with the US Commodities Futures Trading Commission, and worked in a boutique futures house in California in the 1980s.
He was a partner in one of the first futures newsletter advisory services, based in Washington DC, specialising in pork bellies and currencies. John is primarily a chart-reading trader, having cut his trading teeth in the days before PCs.
As well as his work in the financial world, he has launched, run and sold several 'real' businesses producing 'real' products.
-
 MoneyWeek Talks: The funds to choose in 2026
Podcast Fidelity's Tom Stevenson reveals his top three funds for 2026 for your ISA or self-invested personal pension
-
 Three companies with deep economic moats to buy now
Opinion An economic moat can underpin a company's future returns. Here, Imran Sattar, portfolio manager at Edinburgh Investment Trust, selects three stocks to buy now