The euro follows my market roadmap
Using his chart-trading methods, John C Burford draws his roadmap for the euro, while managing the risks should the market run off course.
Get the latest financial news, insights and expert analysis from our award-winning MoneyWeek team, to help you understand what really matters when it comes to your finances.
You are now subscribed
Your newsletter sign-up was successful
Want to add more newsletters?

Twice daily
MoneyWeek
Get the latest financial news, insights and expert analysis from our award-winning MoneyWeek team, to help you understand what really matters when it comes to your finances.

Four times a week
Look After My Bills
Sign up to our free money-saving newsletter, filled with the latest news and expert advice to help you find the best tips and deals for managing your bills. Start saving today!
On Friday, I outlined the many reasons why I expected a significant high in the EUR/USD at the 1.38 level. It could even turn out to be a major high, which may not be breached for a long time. We shall see.
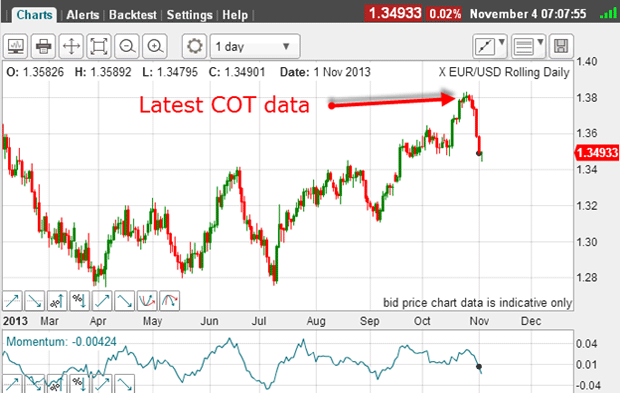
It is interesting to examine the psychology behind a rally at that level. This has to be done in the absence of updated COT (commitment of traders) data, which are still unavailable many days after government officials have returned to work.
The latest rally off the July low at the 1.28 area was centered on the belief that the eurozone economy was finally turning a corner, and that the European Central Bank was still showing no signs of starting their own quantitative easing programme, which would inevitably put pressure on the currency.
MoneyWeek
Subscribe to MoneyWeek today and get your first six magazine issues absolutely FREE

Sign up to Money Morning
Don't miss the latest investment and personal finances news, market analysis, plus money-saving tips with our free twice-daily newsletter
Don't miss the latest investment and personal finances news, market analysis, plus money-saving tips with our free twice-daily newsletter
On the other side of the cross, the dollar was under pressure because of the negative mood surrounding the government shut-down, as well as the fractious debt ceiling drama, which once again highlighted the ballooning US national debt.
If you read the financial press and the many comments on blog posts, you will notice that a large cohort of the US public have an extremely negative attitude towards the dollar. But, then again, maybe it is only the doom-mongers that comment on blog posts.
This negative sentiment induced the large speculators, the hedge funds, to take an aggressive long position on EUR/USD. The last COT report of 22 October shows a ratio of over two-to-one large speculators were bullish.
| (Contracts of EUR 125,000) | Row 0 - Cell 1 | Row 0 - Cell 2 | Row 0 - Cell 3 | Open interest: 278,139 | ||||
| Commitments | ||||||||
| 137,061 | 64,627 | 5,763 | 82,406 | 153,006 | 225,230 | 223,396 | 52,909 | 54,743 |
| Changes from 10/15/13 (Change in open interest: 20,940) | ||||||||
| 15,734 | 3,674 | -279 | -2,071 | 14,171 | 13,384 | 17,566 | 7,556 | 3,374 |
| Percent of open interest for each category of traders | ||||||||
| 49.3 | 23.2 | 2.1 | 29.6 | 55.0 | 81.0 | 80.3 | 19.0 | 19.7 |
| Number of traders in each category (Total traders: 196) | ||||||||
| 60 | 56 | 18 | 48 | 52 | 121 | 113 | Row 8 - Cell 7 | Row 8 - Cell 8 |
Note that that date falls on the high water mark at the 1.38 area!

The importance of potential-momentum divergences
The chart shows that this occurred during the last final spurt up from the 1.35 area, and just in time for them to suffer in the reversal!
Now, with most of the bulls already committed, there was no more buying power remaining. Consequently, the market on Friday fell, as many of the 'last to the party' bulls were stopped out and the bears came out of hibernation.
On the above chart, one key indicator was the momentum reading, which was showing a potential negative divergence. This was cemented as the market declined.
You need to keep an eye out for potential momentum divergences when you suspect a trend is about to reverse. It is one of the most important factors I watch.
The Monday morning market

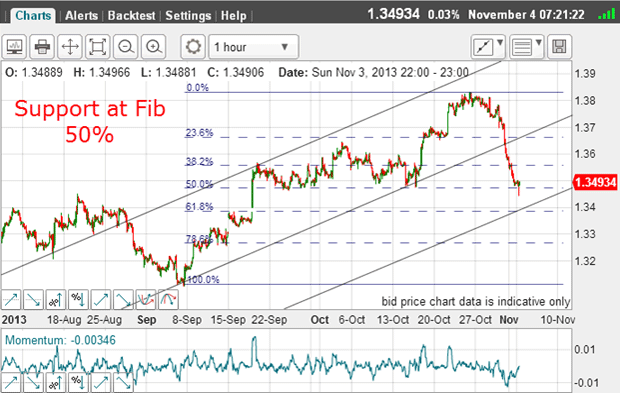
I have drawn in a new tramline trio. The upper one has two to three good PPPs (prior pivot points), and takes in the single touch point of the 19 September high (recall this is wave A of the A-B-C rally).
My centre tramline is a good fit to the lows, and I have drawn in my third tramline, which gives me a possible target.
I have also drawn in my Fibonacci levels, and the decline has taken the market to the 50% level a common support level.
And this is where the market is trading this morning.
Have the battle lines been drawn?

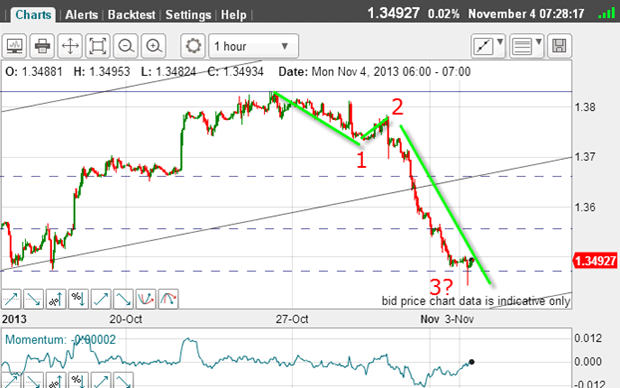
This is the updated chart from Friday. If these labels are correct, then after the one-way wave 3 action, I expect a complex wave 4 up, where there should be much backing and filling over the next few hours.
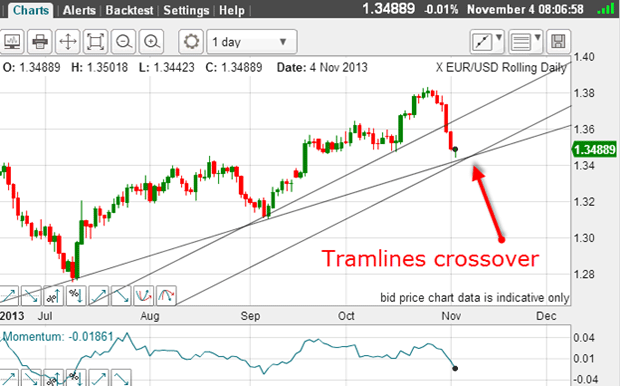
Following the wave 4 high, I then expect a new move lower in wave 5 that should end at, or near, the lower tramline in the above chart.
This would set up a terrific battle, because it would occur in the area where the two major tramlines cross over:

(I have taken out the upper tramlines for clarity.)
Of course, a significant break of this crossover area would send the market much lower.
Mapping the markets
So you see how I use Fibonacci, Elliott waves and tramline analysis to draw a roadmap. And when the market follows it, it gives me confidence in my trade and in my targets.
But, as always, keeping to a sensible stop-loss policy is paramount, because sometimes the market ignores your roadmap and veers off in another direction.
Get the latest financial news, insights and expert analysis from our award-winning MoneyWeek team, to help you understand what really matters when it comes to your finances.
John is is a British-born lapsed PhD physicist, who previously worked for Nasa on the Mars exploration team. He is a former commodity trading advisor with the US Commodities Futures Trading Commission, and worked in a boutique futures house in California in the 1980s.
He was a partner in one of the first futures newsletter advisory services, based in Washington DC, specialising in pork bellies and currencies. John is primarily a chart-reading trader, having cut his trading teeth in the days before PCs.
As well as his work in the financial world, he has launched, run and sold several 'real' businesses producing 'real' products.
-
 MoneyWeek Talks: The funds to choose in 2026
Podcast Fidelity's Tom Stevenson reveals his top three funds for 2026 for your ISA or self-invested personal pension
-
 Three companies with deep economic moats to buy now
Opinion An economic moat can underpin a company's future returns. Here, Imran Sattar, portfolio manager at Edinburgh Investment Trust, selects three stocks to buy now